From Wikipedia, the free encyclopedia
1999 election of members of the European parliament for the United Kingdom
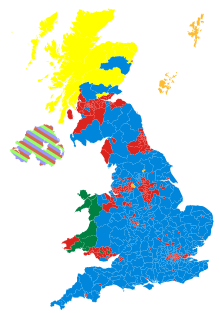 Results of the 1999 election by Westminster constituency.
The United Kingdom's component of the 1999 European Parliament election was held on Thursday 10 June 1999. They were the first nationwide poll since the 1997 United Kingdom general election.
The votes were counted in each Westminster constituency, and the results were amalgamated for the regional lists. These European elections were the first to be fought under proportional representation.[1] The seats were allocated according to the d'Hondt system.[2]
The results saw the Labour government lose over half their seats with the Conservatives becoming the largest party. [3] These elections also saw the emergence of the UK Independence Party and the Green Party of England and Wales.[4]
The results in the Northern Ireland constituency were counted as one constituency using the single transferable vote.[5]
East Midlands[edit]
| Constituency
|
Party won in 1997
|
Con
|
Lab
|
Lib
|
Green
|
UKIP
|
Others
|
Total
|
Party won in 1999
|
| Amber Valley
|
|
Labour
|
5,570
|
5,540
|
1,655
|
894
|
1,328
|
1,027
|
16,014
|
|
Conservative
|
| Ashfield
|
|
Labour
|
3,605
|
5,167
|
1,429
|
648
|
1,010
|
1,442
|
13,301
|
|
Labour
|
| Bassetlaw
|
|
Labour
|
4,730
|
4,842
|
1,556
|
742
|
1,009
|
1,262
|
14,141
|
|
Labour
|
| Blaby
|
|
Conservative
|
8,107
|
3,523
|
2,392
|
887
|
1,384
|
953
|
17,246
|
|
Conservative
|
| Bolsover
|
|
Labour
|
3,149
|
6,208
|
1,298
|
597
|
919
|
1,567
|
13,738
|
|
Labour
|
| Boston and Skegness
|
|
Conservative
|
6,637
|
3,193
|
1,560
|
632
|
1,314
|
791
|
14,127
|
|
Conservative
|
| Bosworth
|
|
Conservative
|
6,761
|
3,677
|
2,111
|
682
|
1,258
|
738
|
15,227
|
|
Conservative
|
| Broxtowe
|
|
Labour
|
7,341
|
5,379
|
2,902
|
1,246
|
1,252
|
1,172
|
19,292
|
|
Conservative
|
| Charnwood
|
|
Conservative
|
8,192
|
3,463
|
2,138
|
963
|
1,697
|
1,007
|
17,460
|
|
Conservative
|
| Chesterfield
|
|
Labour
|
3,390
|
4,681
|
3,893
|
605
|
912
|
1,017
|
14,498
|
|
Labour
|
| Corby
|
|
Labour
|
6,839
|
5,988
|
1,619
|
837
|
1,134
|
964
|
17,381
|
|
Conservative
|
| Daventry
|
|
Conservative
|
10,924
|
4,766
|
2,712
|
1,282
|
1,911
|
1,138
|
22,733
|
|
Conservative
|
| Derby North
|
|
Labour
|
5,794
|
5,661
|
1,689
|
808
|
1,203
|
890
|
16,045
|
|
Conservative
|
| Derby South
|
|
Labour
|
4,503
|
5,981
|
2,444
|
702
|
1,010
|
842
|
15,482
|
|
Labour
|
| Erewash
|
|
Labour
|
6,774
|
5,175
|
2,078
|
886
|
1,198
|
1,046
|
17,157
|
|
Conservative
|
| Gainsborough
|
|
Conservative
|
8,147
|
3,138
|
2,730
|
1,019
|
1,387
|
823
|
17,244
|
|
Conservative
|
| Gedling
|
|
Labour
|
6,982
|
4,358
|
1,806
|
869
|
1,156
|
1,045
|
16,216
|
|
Conservative
|
| Grantham and Stamford
|
|
Conservative
|
8,408
|
3,891
|
1,934
|
1,068
|
1,697
|
972
|
17,970
|
|
Conservative
|
| Harborough
|
|
Conservative
|
8,228
|
3,150
|
3,233
|
841
|
1,404
|
900
|
17,756
|
|
Conservative
|
| High Peak
|
|
Labour
|
6,845
|
5,368
|
2,936
|
1,326
|
1,234
|
1,018
|
18,727
|
|
Conservative
|
| Kettering
|
|
Labour
|
9,131
|
5,483
|
2,192
|
999
|
1,541
|
1,009
|
20,355
|
|
Conservative
|
| Leicester East
|
|
Labour
|
4,046
|
5,984
|
1,443
|
574
|
716
|
838
|
13,601
|
|
Labour
|
| Leicester South
|
|
Labour
|
3,911
|
6,077
|
2,653
|
925
|
688
|
967
|
15,221
|
|
Labour
|
| Leicester West
|
|
Labour
|
3,173
|
3,644
|
1,885
|
721
|
616
|
679
|
10,718
|
|
Labour
|
| Lincoln
|
|
Labour
|
4,666
|
4,748
|
1,503
|
762
|
1,004
|
724
|
13,407
|
|
Labour
|
| Loughborough
|
|
Labour
|
5,892
|
4,859
|
1,904
|
958
|
1,102
|
950
|
15,665
|
|
Conservative
|
| Louth and Horncastle
|
|
Conservative
|
9,122
|
3,386
|
2,320
|
1,166
|
1,964
|
1,041
|
18,999
|
|
Conservative
|
| Mansfield
|
|
Labour
|
3,444
|
4,085
|
1,239
|
531
|
843
|
1,138
|
11,280
|
|
Labour
|
| Newark
|
|
Labour
|
7,872
|
3,824
|
2,221
|
787
|
1,202
|
1,153
|
17,059
|
|
Conservative
|
| North East Derbyshire
|
|
Labour
|
4,234
|
5,152
|
2,083
|
735
|
1,166
|
1,330
|
14,700
|
|
Labour
|
| North West Leicestershire
|
|
Labour
|
5,586
|
5,002
|
1,625
|
793
|
1,342
|
934
|
15,282
|
|
Conservative
|
| Northampton North
|
|
Labour
|
4,746
|
4,503
|
2,326
|
766
|
1,143
|
779
|
14,263
|
|
Conservative
|
| Northampton South
|
|
Labour
|
7,479
|
4,867
|
2,182
|
966
|
1,484
|
984
|
17,962
|
|
Conservative
|
| Nottingham East
|
|
Labour
|
3,442
|
5,326
|
1,362
|
1,009
|
603
|
1,121
|
12,863
|
|
Labour
|
| Nottingham North
|
|
Labour
|
2,867
|
4,793
|
1,137
|
532
|
698
|
844
|
10,871
|
|
Labour
|
| Nottingham South
|
|
Labour
|
4,759
|
5,372
|
2,064
|
871
|
754
|
1,121
|
14,941
|
|
Labour
|
| Rushcliffe
|
|
Conservative
|
10,181
|
5,040
|
3,345
|
1,435
|
1,585
|
1,375
|
22,961
|
|
Conservative
|
| Rutland and Melton
|
|
Conservative
|
9,581
|
3,680
|
2,381
|
1,123
|
1,747
|
1,186
|
19,698
|
|
Conservative
|
| Sherwood
|
|
Labour
|
5,999
|
5,062
|
1,723
|
813
|
1,183
|
1,448
|
16,228
|
|
Conservative
|
| Sleaford and North Hykeham
|
|
Conservative
|
10,291
|
4,088
|
2,642
|
958
|
1,616
|
935
|
20,530
|
|
Conservative
|
| South Derbyshire
|
|
Labour
|
6,671
|
5,715
|
1,562
|
907
|
1,649
|
991
|
17,495
|
|
Conservative
|
| South Holland and The Deepings
|
|
Conservative
|
9,290
|
3,139
|
1,781
|
761
|
1,533
|
963
|
17,467
|
|
Conservative
|
| Wellingborough
|
|
Labour
|
7,508
|
5,456
|
1,760
|
957
|
1,590
|
852
|
18,123
|
|
Conservative
|
| West Derbyshire
|
|
Conservative
|
10,845
|
4,322
|
2,950
|
1,371
|
1,614
|
1,187
|
22,289
|
|
Conservative
|
East of England[edit]
| Constituency
|
Party won in 1997
|
Con
|
Lab
|
Lib
|
Green
|
UKIP
|
Others
|
Total
|
Party won in 1999
|
| Basildon
|
|
Labour
|
4,818
|
5,121
|
973
|
795
|
1,396
|
673
|
13,776
|
|
Labour
|
| Bedford
|
|
Labour
|
5,859
|
6,066
|
2,342
|
935
|
1,001
|
869
|
17,072
|
|
Labour
|
| Billericay
|
|
Conservative
|
6,902
|
3,646
|
1,476
|
898
|
1,773
|
768
|
15,463
|
|
Conservative
|
| Braintree
|
|
Labour
|
7,492
|
5,386
|
1,837
|
1,355
|
1,881
|
833
|
18,784
|
|
Conservative
|
| Brentwood & Ongar
|
|
Conservative
|
8,181
|
2,901
|
2,262
|
1,002
|
2,046
|
991
|
17,383
|
|
Conservative
|
| Broxbourne
|
|
Conservative
|
6,736
|
2,528
|
840
|
638
|
1,134
|
731
|
12,607
|
|
Conservative
|
| Bury St Edmunds
|
|
Conservative
|
7,867
|
4,440
|
2,516
|
1,232
|
2,351
|
1,065
|
19,471
|
|
Conservative
|
| Cambridge
|
|
Labour
|
4,278
|
5,109
|
3,458
|
1,901
|
850
|
801
|
16,397
|
|
Labour
|
| Castle Point
|
|
Labour
|
6,891
|
4,215
|
722
|
761
|
1,660
|
733
|
14,982
|
|
Conservative
|
| Central Suffolk & North Ipswich
|
|
Conservative
|
8,143
|
4,118
|
2,302
|
1,354
|
1,664
|
994
|
18,575
|
|
Conservative
|
| Colchester
|
|
Liberal Democrat
|
6,105
|
4,350
|
3,191
|
993
|
1,313
|
904
|
16,856
|
|
Conservative
|
| Epping Forest
|
|
Conservative
|
7,930
|
3,139
|
1,650
|
923
|
1,528
|
954
|
16,124
|
|
Conservative
|
| Great Yarmouth
|
|
Labour
|
6,427
|
5,318
|
1,268
|
677
|
1,159
|
805
|
15,654
|
|
Conservative
|
| Harlow
|
|
Labour
|
4,701
|
4,845
|
1,312
|
810
|
1,476
|
655
|
13,799
|
|
Labour
|
| Harwich
|
|
Labour
|
8,875
|
4,549
|
1,645
|
877
|
2,940
|
942
|
19,828
|
|
Conservative
|
| Hemel Hempstead
|
|
Labour
|
8,199
|
5,849
|
1,669
|
1,160
|
1,220
|
842
|
18,939
|
|
Conservative
|
| Hertford & Stortford
|
|
Conservative
|
7,982
|
4,010
|
2,303
|
1,315
|
2,216
|
853
|
18,679
|
|
Conservative
|
| Hertsmere
|
|
Conservative
|
7,126
|
3,557
|
1,391
|
860
|
1,243
|
898
|
15,075
|
|
Conservative
|
| Hitchin & Harpenden
|
|
Conservative
|
9,737
|
4,041
|
2,412
|
1,235
|
1,237
|
900
|
19,562
|
|
Conservative
|
| Huntingdon
|
|
Conservative
|
11,303
|
3,330
|
3,036
|
967
|
1,650
|
995
|
21,281
|
|
Conservative
|
| Ipswich
|
|
Labour
|
4,686
|
4,848
|
1,603
|
917
|
888
|
685
|
13,627
|
|
Labour
|
| Luton North
|
|
Labour
|
4,580
|
4,649
|
996
|
573
|
969
|
579
|
12,346
|
|
Labour
|
| Luton South
|
|
Labour
|
4,279
|
5,299
|
1,414
|
693
|
892
|
724
|
13,301
|
|
Labour
|
| Maldon & East Chelmsford
|
|
Conservative
|
8,169
|
3,178
|
2,230
|
1,173
|
1,920
|
822
|
17,492
|
|
Conservative
|
| Mid Bedfordshire
|
|
Conservative
|
9,006
|
4,083
|
2,290
|
1,067
|
1,556
|
923
|
18,925
|
|
Conservative
|
| Mid Norfolk
|
|
Conservative
|
9,822
|
6,098
|
2,345
|
1,653
|
1,994
|
1,419
|
23,331
|
|
Conservative
|
| North East Bedfordshire
|
|
Conservative
|
9,544
|
4,079
|
1,939
|
1,112
|
1,616
|
950
|
19,240
|
|
Conservative
|
| North East Cambridgeshire
|
|
Conservative
|
8,801
|
3,807
|
1,620
|
762
|
1,437
|
792
|
17,219
|
|
Conservative
|
| North East Hertfordshire
|
|
Conservative
|
8,792
|
4,368
|
2,237
|
1,098
|
1,535
|
859
|
18,889
|
|
Conservative
|
| North Essex
|
|
Conservative
|
8,748
|
3,914
|
2,171
|
1,284
|
2,140
|
1,053
|
19,310
|
|
Conservative
|
| North Norfolk
|
|
Conservative
|
11,111
|
5,649
|
3,706
|
1,525
|
2,132
|
1,628
|
25,751
|
|
Conservative
|
| North West Cambridgeshire
|
|
Conservative
|
8,319
|
3,602
|
1,861
|
850
|
1,339
|
817
|
16,788
|
|
Conservative
|
| North West Norfolk
|
|
Labour
|
9,097
|
5,736
|
1,581
|
1,087
|
1,564
|
902
|
19,967
|
|
Conservative
|
| Norwich North
|
|
Labour
|
6,667
|
5,894
|
2,043
|
956
|
1,189
|
940
|
17,689
|
|
Conservative
|
| Norwich South
|
|
Labour
|
4,825
|
6,128
|
3,005
|
1,569
|
913
|
972
|
17,412
|
|
Labour
|
| Peterborough
|
|
Labour
|
5,692
|
4,498
|
1,178
|
659
|
1,089
|
924
|
14,040
|
|
Conservative
|
| Rayleigh
|
|
Conservative
|
7,808
|
3,121
|
1,637
|
1,091
|
2,054
|
711
|
16,422
|
|
Conservative
|
| Rochford & Southend East
|
|
Conservative
|
6,663
|
3,467
|
918
|
847
|
1,412
|
739
|
14,046
|
|
Conservative
|
| Saffron Walden
|
|
Conservative
|
9,854
|
3,512
|
3,253
|
1,509
|
2,203
|
1,112
|
21,443
|
|
Conservative
|
| South Cambridgeshire
|
|
Conservative
|
9,621
|
4,367
|
3,769
|
1,659
|
1,606
|
1,120
|
22,142
|
|
Conservative
|
| South East Cambridgeshire
|
|
Conservative
|
9,071
|
4,082
|
3,723
|
1,422
|
1,773
|
986
|
21,057
|
|
Conservative
|
| South Norfolk
|
|
Conservative
|
10,059
|
5,181
|
3,750
|
1,579
|
1,922
|
1,484
|
23,975
|
|
Conservative
|
| South Suffolk
|
|
Conservative
|
8,213
|
3,736
|
2,924
|
1,270
|
1,983
|
978
|
19,104
|
|
Conservative
|
| South West Bedfordshire
|
|
Conservative
|
7,098
|
4,483
|
2,005
|
1,023
|
1,860
|
766
|
17,235
|
|
Conservative
|
| South West Hertfordshire
|
|
Conservative
|
9,935
|
3,606
|
2,969
|
1,266
|
1,489
|
994
|
20,259
|
|
Conservative
|
| South West Norfolk
|
|
Conservative
|
10,475
|
4,956
|
1,906
|
1,295
|
2,314
|
1,220
|
22,166
|
|
Conservative
|
| Southend West
|
|
Conservative
|
7,407
|
2,733
|
2,137
|
843
|
1,675
|
772
|
15,567
|
|
Conservative
|
| St Albans
|
|
Labour
|
6,688
|
4,928
|
2,728
|
1,349
|
1,227
|
845
|
17,765
|
|
Conservative
|
| Stevenage
|
|
Labour
|
5,069
|
5,581
|
1,524
|
872
|
1,130
|
647
|
14,823
|
|
Labour
|
| Suffolk Coastal
|
|
Conservative
|
10,080
|
4,681
|
3,175
|
1,707
|
1,940
|
1,105
|
22,688
|
|
Conservative
|
| Thurrock
|
|
Labour
|
3,443
|
4,288
|
791
|
641
|
1,307
|
539
|
11,009
|
|
Labour
|
| Watford
|
|
Labour
|
5,866
|
5,049
|
2,240
|
920
|
1,019
|
836
|
15,930
|
|
Conservative
|
| Waveney
|
|
Labour
|
6,847
|
6,781
|
1,957
|
1,141
|
1,584
|
890
|
19,200
|
|
Conservative
|
| Welwyn Hatfield
|
|
Labour
|
7,050
|
5,245
|
1,707
|
1,033
|
1,273
|
890
|
17,198
|
|
Conservative
|
| West Chelmsford
|
|
Conservative
|
8,038
|
4,226
|
3,271
|
1,267
|
1,690
|
966
|
19,458
|
|
Conservative
|
| West Suffolk
|
|
Conservative
|
8,116
|
3,761
|
1,614
|
934
|
2,080
|
809
|
17,314
|
|
Conservative
|
| Constituency
|
Party won in 1997
|
Con
|
Lab
|
Lib
|
Green
|
UKIP
|
Others
|
Total
|
Party won in 1999
|
| Barking
|
|
Labour
|
1,993
|
4,003
|
956
|
494
|
805
|
1,075
|
9,326
|
|
Labour
|
| Battersea
|
|
Labour
|
5,896
|
5,686
|
1,241
|
1,309
|
433
|
986
|
15,551
|
|
Conservative
|
| Beckenham
|
|
Conservative
|
9,382
|
4,818
|
3,126
|
1,415
|
1,397
|
1,238
|
21,376
|
|
Conservative
|
| Bethnal Green and Bow
|
|
Labour
|
4,075
|
5,769
|
1,742
|
1,370
|
542
|
1,974
|
15,472
|
|
Labour
|
| Bexleyheath and Crayford
|
|
Labour
|
6,758
|
5,125
|
1,344
|
835
|
1,332
|
1,000
|
16,394
|
|
Conservative
|
| Brent East
|
|
Labour
|
3,033
|
6,239
|
1,053
|
1,126
|
320
|
947
|
12,718
|
|
Labour
|
| Brent North
|
|
Labour
|
5,189
|
5,325
|
1,181
|
659
|
522
|
845
|
13,721
|
|
Labour
|
| Brent South
|
|
Labour
|
2,244
|
6,772
|
1,148
|
654
|
268
|
881
|
11,967
|
|
Labour
|
| Brentford and Isleworth
|
|
Labour
|
5,911
|
7,448
|
2,264
|
1,578
|
997
|
1,271
|
19,469
|
|
Labour
|
| Bromley and Chislehurst
|
|
Conservative
|
9,209
|
3,792
|
2,406
|
1,271
|
1,717
|
1,186
|
19,581
|
|
Conservative
|
| Camberwell and Peckham
|
|
Labour
|
1,267
|
4,702
|
1,068
|
875
|
343
|
783
|
9,038
|
|
Labour
|
| Carshalton and Wallington
|
|
Liberal Democrat
|
5,647
|
3,076
|
3,494
|
878
|
1,298
|
1,017
|
15,410
|
|
Conservative
|
| Chingford and Woodford Green
|
|
Conservative
|
7,113
|
3,289
|
1,625
|
1,040
|
1,166
|
1,202
|
15,435
|
|
Conservative
|
| Chipping Barnet
|
|
Conservative
|
8,220
|
5,501
|
2,067
|
1,302
|
850
|
1,520
|
19,460
|
|
Conservative
|
| Cities of London and Westminster
|
|
Conservative
|
7,869
|
3,761
|
1,761
|
1,041
|
673
|
1,367
|
16,472
|
|
Conservative
|
| Croydon Central
|
|
Labour
|
7,704
|
5,610
|
1,959
|
1,133
|
1,690
|
1,077
|
19,173
|
|
Conservative
|
| Croydon North
|
|
Labour
|
4,794
|
7,519
|
1,383
|
1,037
|
876
|
1,093
|
16,702
|
|
Labour
|
| Croydon South
|
|
Conservative
|
10,639
|
3,442
|
2,554
|
1,315
|
1,645
|
1,226
|
20,821
|
|
Conservative
|
| Dagenham
|
|
Labour
|
2,314
|
4,135
|
754
|
458
|
906
|
1,050
|
9,617
|
|
Labour
|
| Dulwich and West Norwood
|
|
Labour
|
4,323
|
5,729
|
1,867
|
2,071
|
527
|
1,094
|
15,611
|
|
Labour
|
| Ealing North
|
|
Labour
|
6,628
|
7,477
|
1,928
|
1,326
|
1,197
|
1,242
|
19,798
|
|
Labour
|
| Ealing, Acton and Shepherd's Bush
|
|
Labour
|
3,756
|
10,063
|
1,727
|
1,496
|
781
|
1,532
|
19,355
|
|
Labour
|
| Ealing Southall
|
|
Labour
|
4,444
|
7,041
|
1,896
|
1,570
|
765
|
1,284
|
17,000
|
|
Labour
|
| East Ham
|
|
Labour
|
2,785
|
8,618
|
1,099
|
708
|
541
|
1,443
|
15,194
|
|
Labour
|
| Edmonton
|
|
Labour
|
4,179
|
5,202
|
823
|
607
|
934
|
1,445
|
13,190
|
|
Labour
|
| Eltham
|
|
Labour
|
4,840
|
5,517
|
1,359
|
930
|
906
|
1,079
|
14,631
|
|
Labour
|
| Enfield North
|
|
Labour
|
5,822
|
4,890
|
1,168
|
790
|
1,147
|
1,043
|
14,860
|
|
Conservative
|
| Enfield Southgate
|
|
Labour
|
7,175
|
4,921
|
1,761
|
1,059
|
923
|
1,865
|
17,704
|
|
Conservative
|
| Erith and Thamesmead
|
|
Labour
|
2,979
|
5,290
|
924
|
727
|
811
|
1,225
|
11,956
|
|
Labour
|
| Feltham and Heston
|
|
Labour
|
3,646
|
6,571
|
1,206
|
661
|
959
|
1,042
|
14,085
|
|
Labour
|
| Finchley and Golders Green
|
|
Labour
|
6,895
|
6,697
|
2,125
|
1,682
|
610
|
1,543
|
19,552
|
|
Conservative
|
| Greenwich and Woolwich
|
|
Labour
|
2,858
|
5,777
|
1,469
|
1,255
|
608
|
1,101
|
13,068
|
|
Labour
|
| Hackney North and Stoke Newington
|
|
Labour
|
1,831
|
5,612
|
940
|
1,927
|
276
|
1,114
|
11,700
|
|
Labour
|
| Hackney South and Shoreditch
|
|
Labour
|
1,797
|
5,433
|
1,266
|
1,307
|
343
|
1,266
|
11,412
|
|
Labour
|
| Hammersmith and Fulham
|
|
Labour
|
7,685
|
6,647
|
1,767
|
1,578
|
693
|
1,235
|
19,605
|
|
Conservative
|
| Hampstead and Highgate
|
|
Labour
|
4,283
|
5,570
|
2,303
|
2,025
|
570
|
1,331
|
16,082
|
|
Labour
|
| Harrow East
|
|
Labour
|
6,825
|
7,698
|
1,980
|
931
|
828
|
1,166
|
19,428
|
|
Labour
|
| Harrow West
|
|
Labour
|
7,928
|
6,256
|
2,234
|
1,103
|
1,052
|
1,091
|
19,664
|
|
Conservative
|
| Hayes and Harlington
|
|
Labour
|
2,882
|
4,640
|
740
|
450
|
668
|
687
|
10,067
|
|
Labour
|
| Hendon
|
|
Labour
|
6,235
|
6,141
|
1,982
|
869
|
887
|
1,205
|
17,319
|
|
Conservative
|
| Holborn and St Pancras
|
|
Labour
|
2,650
|
5,786
|
1,669
|
1,864
|
480
|
1,375
|
13,824
|
|
Labour
|
| Hornchurch
|
|
Labour
|
5,301
|
3,943
|
907
|
619
|
1,209
|
807
|
12,786
|
|
Conservative
|
| Hornsey and Wood Green
|
|
Labour
|
3,466
|
7,891
|
2,780
|
2,828
|
562
|
1,760
|
19,287
|
|
Labour
|
| Ilford North
|
|
Labour
|
6,669
|
4,832
|
1,156
|
870
|
974
|
910
|
15,411
|
|
Conservative
|
| Ilford South
|
|
Labour
|
5,174
|
7,830
|
1,093
|
775
|
755
|
970
|
16,597
|
|
Labour
|
| Islington North
|
|
Labour
|
1,601
|
5,102
|
1,494
|
2,111
|
262
|
1,193
|
11,763
|
|
Labour
|
| Islington South and Finsbury
|
|
Labour
|
1,973
|
4,496
|
2,374
|
1,303
|
453
|
1,067
|
11,666
|
|
Labour
|
| Kensington and Chelsea
|
|
Conservative
|
8,347
|
2,536
|
1,659
|
994
|
639
|
1,143
|
15,318
|
|
Conservative
|
| Kingston and Surbiton
|
|
Liberal Democrat
|
7,327
|
4,107
|
4,067
|
1,385
|
1,402
|
1,073
|
19,361
|
|
Conservative
|
| Lewisham East
|
|
Labour
|
1,557
|
5,109
|
995
|
1,621
|
444
|
1,002
|
10,728
|
|
Labour
|
| Lewisham West
|
|
Labour
|
3,182
|
4,332
|
1,498
|
981
|
672
|
823
|
11,488
|
|
Labour
|
| Lewisham Deptford
|
|
Labour
|
2,924
|
4,731
|
1,167
|
1,198
|
686
|
924
|
11,630
|
|
Labour
|
| Leyton and Wanstead
|
|
Labour
|
3,212
|
5,518
|
2,486
|
1,212
|
613
|
1,254
|
14,295
|
|
Labour
|
| Mitcham and Morden
|
|
Labour
|
4,069
|
6,560
|
1,076
|
891
|
911
|
954
|
14,461
|
|
Labour
|
| North Southwark and Bermondsey
|
|
Liberal Democrat
|
1,794
|
4,657
|
4,129
|
961
|
571
|
1,401
|
13,513
|
|
Labour
|
| Old Bexley and Sidcup
|
|
Conservative
|
7,980
|
4,476
|
1,887
|
788
|
1,504
|
1,054
|
17,689
|
|
Conservative
|
| Orpington
|
|
Conservative
|
10,430
|
3,969
|
3,480
|
1,328
|
1,887
|
1,294
|
22,388
|
|
Conservative
|
| Poplar and Canning Town
|
|
Labour
|
2,985
|
5,435
|
1,074
|
755
|
585
|
1,608
|
12,442
|
|
Labour
|
| Putney
|
|
Labour
|
5,628
|
4,813
|
1,629
|
1,205
|
663
|
990
|
14,928
|
|
Conservative
|
| Regent's Park and Kensington North
|
|
Labour
|
4,934
|
6,932
|
1,543
|
1,340
|
518
|
1,250
|
16,517
|
|
Labour
|
| Richmond Park
|
|
Liberal Democrat
|
9,242
|
4,640
|
4,809
|
2,015
|
1,118
|
1,593
|
23,417
|
|
Conservative
|
| Romford
|
|
Labour
|
6,130
|
3,689
|
1,005
|
698
|
1,262
|
953
|
13,737
|
|
Conservative
|
| Ruislip-Northwood
|
|
Conservative
|
7,870
|
3,486
|
1,864
|
816
|
1,237
|
955
|
16,228
|
|
Conservative
|
| Streatham
|
|
Labour
|
2,978
|
5,641
|
1,980
|
1,813
|
495
|
937
|
13,844
|
|
Labour
|
| Sutton and Cheam
|
|
Liberal Democrat
|
7,072
|
2,427
|
3,799
|
858
|
1,047
|
941
|
16,144
|
|
Conservative
|
| Tooting
|
|
Labour
|
4,704
|
7,001
|
1,490
|
1,493
|
512
|
1,039
|
16,239
|
|
Labour
|
| Tottenham
|
|
Labour
|
1,860
|
6,648
|
1,038
|
1,256
|
407
|
1,613
|
12,822
|
|
Labour
|
| Twickenham
|
|
Liberal Democrat
|
8,197
|
4,742
|
4,084
|
2,103
|
1,239
|
1,474
|
21,839
|
|
Conservative
|
| Upminster
|
|
Labour
|
5,828
|
4,107
|
1,199
|
768
|
1,568
|
926
|
14,396
|
|
Conservative
|
| Uxbridge
|
|
Conservative
|
5,841
|
3,647
|
1,401
|
681
|
920
|
830
|
13,320
|
|
Conservative
|
| Vauxhall
|
|
Labour
|
2,050
|
5,241
|
1,592
|
1,368
|
357
|
840
|
11,448
|
|
Labour
|
| Walthamstow
|
|
Labour
|
2,549
|
5,533
|
1,680
|
1,375
|
692
|
1,221
|
13,050
|
|
Labour
|
| West Ham
|
|
Labour
|
2,174
|
6,665
|
878
|
782
|
425
|
1,274
|
12,198
|
|
Labour
|
| Wimbledon
|
|
Labour
|
6,238
|
5,142
|
2,386
|
1,628
|
866
|
1,207
|
17,467
|
|
Conservative
|
North East[edit]
| Constituency
|
Party won in 1997
|
Con
|
Lab
|
Lib
|
Green
|
UKIP
|
Others
|
Total
|
Party won in 1999
|
| #
|
%
|
#
|
%
|
#
|
%
|
#
|
%
|
#
|
%
|
#
|
%
|
| Berwick-upon-Tweed
|
|
Liberal Democrat
|
5,139
|
34.5
|
3,268
|
22.0
|
3,572
|
24.0
|
722
|
4.9
|
1,777
|
11.9
|
398
|
2.7
|
14,876
|
|
Conservative
|
| Bishop Auckland
|
|
Labour
|
3,749
|
27.3
|
5,749
|
41.9
|
1,966
|
14.3
|
534
|
3.9
|
1,302
|
9.5
|
427
|
3.1
|
13,727
|
|
Labour
|
| Blaydon
|
|
Labour
|
2,747
|
20.0
|
5,905
|
43.0
|
2,850
|
20.7
|
744
|
5.4
|
1,110
|
8.1
|
392
|
2.9
|
13,748
|
|
Labour
|
| Blyth Valley
|
|
Labour
|
2,406
|
21.5
|
5,186
|
46.4
|
1,581
|
14.2
|
539
|
4.8
|
1,116
|
10.0
|
343
|
3.1
|
11,171
|
|
Labour
|
| City of Durham
|
|
Labour
|
3,263
|
36.1
|
6,409
|
39.8
|
2,724
|
9.3
|
896
|
4.2
|
1,106
|
7.2
|
486
|
3.3
|
14,884
|
|
Labour
|
| Darlington
|
|
Labour
|
5,042
|
21.9
|
5,560
|
43.1
|
1,293
|
18.3
|
588
|
6.0
|
1,010
|
7.4
|
467
|
3.3
|
13,960
|
|
Labour
|
| Easington
|
|
Labour
|
1,541
|
14.3
|
6,690
|
62.2
|
800
|
7.4
|
451
|
4.2
|
794
|
7.4
|
476
|
4.4
|
10,752
|
|
Labour
|
| Gateshead East & Washington West
|
|
Labour
|
1,478
|
12.9
|
5,704
|
49.8
|
2,427
|
21.2
|
450
|
3.9
|
946
|
8.3
|
447
|
3.9
|
11,452
|
|
Labour
|
| Hartlepool
|
|
Labour
|
3,347
|
31.2
|
4,096
|
38.1
|
1,585
|
14.8
|
446
|
4.2
|
909
|
8.5
|
361
|
3.4
|
10,744
|
|
Labour
|
| Hexham
|
|
Conservative
|
7,875
|
43.2
|
4,335
|
23.8
|
2,637
|
14.5
|
986
|
5.4
|
1,936
|
10.6
|
463
|
2.5
|
18,232
|
|
Conservative
|
| Houghton & Washington East
|
|
Labour
|
2,078
|
19.3
|
5,976
|
55.4
|
1,014
|
9.4
|
480
|
4.4
|
860
|
8.0
|
380
|
3.5
|
10,788
|
|
Labour
|
| Jarrow
|
|
Labour
|
2,660
|
21.1
|
6,484
|
51.4
|
1,718
|
13.6
|
471
|
3.7
|
787
|
6.2
|
501
|
4.0
|
12,621
|
|
Labour
|
| Middlesbrough
|
|
Labour
|
3,187
|
27.5
|
5,381
|
46.5
|
973
|
8.4
|
525
|
4.5
|
978
|
8.4
|
530
|
4.6
|
11,574
|
|
Labour
|
| Middlesbrough South & East Cleveland
|
|
Labour
|
6,198
|
41.2
|
4,711
|
31.3
|
1,708
|
11.3
|
666
|
4.4
|
1,273
|
8.5
|
501
|
3.3
|
15,057
|
|
Conservative
|
| Newcastle upon Tyne Central
|
|
Labour
|
3,412
|
25.4
|
5,332
|
39.7
|
2,114
|
15.7
|
1,080
|
8.0
|
970
|
7.2
|
534
|
4.0
|
13,442
|
|
Labour
|
| Newcastle upon Tyne East & Wallsend
|
|
Labour
|
2,043
|
18.6
|
4,957
|
45.1
|
2,093
|
19.1
|
608
|
5.5
|
916
|
8.3
|
366
|
3.3
|
10,983
|
|
Labour
|
| Newcastle upon Tyne North
|
|
Labour
|
3,534
|
27.1
|
5,215
|
40.0
|
2,088
|
16.0
|
549
|
4.2
|
1,230
|
9.4
|
407
|
3.1
|
13,023
|
|
Labour
|
| North Durham
|
|
Labour
|
2,672
|
18.7
|
7,712
|
54.0
|
1,520
|
10.6
|
599
|
4.2
|
1,340
|
9.4
|
448
|
3.1
|
14,291
|
|
Labour
|
| North Tyneside
|
|
Labour
|
2,587
|
21.0
|
6,222
|
50.4
|
1,322
|
10.7
|
575
|
4.7
|
1,241
|
10.1
|
398
|
3.2
|
12,345
|
|
Labour
|
| North West Durham
|
|
Labour
|
3,298
|
22.7
|
6,738
|
46.4
|
1,694
|
11.7
|
682
|
4.7
|
1,617
|
11.1
|
477
|
3.3
|
14,506
|
|
Labour
|
| Redcar
|
|
Labour
|
4,129
|
31.8
|
4,781
|
36.8
|
1,869
|
14.4
|
545
|
4.2
|
1,199
|
9.2
|
466
|
3.6
|
12,989
|
|
Labour
|
| Sedgefield
|
|
Labour
|
3,531
|
25.8
|
6,633
|
48.4
|
1,192
|
8.7
|
552
|
4.0
|
1,257
|
9.2
|
541
|
3.9
|
13,706
|
|
Labour
|
| South Shields
|
|
Labour
|
2,682
|
25.1
|
5,021
|
47.0
|
1,120
|
10.5
|
485
|
4.5
|
893
|
8.4
|
492
|
4.6
|
10,693
|
|
Labour
|
| Stockton North
|
|
Labour
|
3,116
|
29.3
|
4,574
|
43.0
|
1,153
|
10.8
|
427
|
4.0
|
993
|
9.3
|
383
|
3.6
|
10,646
|
|
Labour
|
| Stockton South
|
|
Labour
|
5,478
|
38.4
|
4,611
|
32.3
|
2,125
|
14.9
|
490
|
3.4
|
1,144
|
8.0
|
423
|
3.0
|
14,271
|
|
Conservative
|
| Sunderland North
|
|
Labour
|
2,978
|
29.2
|
4,724
|
46.4
|
840
|
8.2
|
417
|
4.1
|
741
|
7.3
|
485
|
4.8
|
10,185
|
|
Labour
|
| Sunderland South
|
|
Labour
|
3,352
|
31.4
|
4,748
|
44.5
|
932
|
8.7
|
435
|
4.1
|
770
|
7.2
|
442
|
4.1
|
10,679
|
|
Labour
|
| Tyne Bridge
|
|
Labour
|
1,550
|
17.7
|
4,710
|
53.7
|
848
|
9.7
|
534
|
6.1
|
716
|
8.2
|
411
|
4.7
|
8,769
|
|
Labour
|
| Tynemouth
|
|
Labour
|
7,552
|
40.1
|
6,489
|
34.4
|
1,759
|
9.3
|
860
|
4.6
|
1,698
|
9.0
|
490
|
2.6
|
18,848
|
|
Conservative
|
| Wansbeck
|
|
Labour
|
2,949
|
23.1
|
4,652
|
36.4
|
2,553
|
20.0
|
848
|
6.6
|
1,434
|
11.2
|
343
|
2.7
|
12,779
|
|
Labour
|
North West[edit]
| Constituency
|
Party won in 1997
|
Con
|
Lab
|
Lib
|
Green
|
UKIP
|
Others
|
Total
|
Party won in 1999
|
| Altrincham & Sale West
|
|
Conservative
|
7,913
|
4,028
|
1,667
|
924
|
1,025
|
819
|
16,376
|
|
Conservative
|
| Ashton-under-Lyne
|
|
Labour
|
2,957
|
5,276
|
1,186
|
548
|
793
|
824
|
11,584
|
|
Labour
|
| Barrow & Furness
|
|
Labour
|
5,432
|
4,684
|
1,026
|
708
|
1,004
|
769
|
13,623
|
|
Conservative
|
| Birkenhead
|
|
Labour
|
2,203
|
3,888
|
957
|
558
|
465
|
584
|
8,655
|
|
Labour
|
| Blackburn
|
|
Labour
|
4,280
|
4,303
|
976
|
612
|
1,202
|
1,207
|
12,580
|
|
Labour
|
| Blackpool North & Fleetwood
|
|
Labour
|
7,268
|
6,170
|
1,030
|
629
|
1,343
|
938
|
17,378
|
|
Conservative
|
| Blackpool South
|
|
Labour
|
5,586
|
6,205
|
893
|
553
|
1,188
|
885
|
15,310
|
|
Labour
|
| Bolton North East
|
|
Labour
|
5,410
|
5,132
|
1,015
|
609
|
655
|
838
|
13,659
|
|
Conservative
|
| Bolton South East
|
|
Labour
|
2,742
|
5,597
|
884
|
440
|
589
|
795
|
11,047
|
|
Labour
|
| Bolton West
|
|
Labour
|
5,490
|
4,621
|
1,790
|
634
|
767
|
784
|
14,086
|
|
Conservative
|
| Bootle
|
|
Labour
|
1,085
|
4,468
|
527
|
355
|
314
|
491
|
7,240
|
|
Labour
|
| Burnley
|
|
Labour
|
3,263
|
4,372
|
1,263
|
610
|
1,042
|
1,083
|
11,633
|
|
Labour
|
| Bury North
|
|
Labour
|
6,397
|
5,629
|
1,146
|
874
|
999
|
842
|
15,887
|
|
Conservative
|
| Bury South
|
|
Labour
|
4,798
|
5,541
|
1,073
|
755
|
802
|
750
|
13,719
|
|
Labour
|
| Carlisle
|
|
Labour
|
5,117
|
4,290
|
1,152
|
622
|
740
|
796
|
12,717
|
|
Conservative
|
| Cheadle
|
|
Conservative
|
7,649
|
2,948
|
3,806
|
800
|
1,357
|
911
|
17,471
|
|
Conservative
|
| City of Chester
|
|
Labour
|
6,657
|
6,408
|
2,227
|
1,023
|
1,502
|
883
|
18,700
|
|
Conservative
|
| Chorley
|
|
Labour
|
7,571
|
5,722
|
1,553
|
871
|
1,214
|
951
|
17,882
|
|
Conservative
|
| Congleton
|
|
Conservative
|
6,978
|
3,522
|
2,937
|
814
|
976
|
922
|
16,149
|
|
Conservative
|
| Copeland
|
|
Labour
|
5,170
|
6,428
|
917
|
449
|
686
|
753
|
14,403
|
|
Labour
|
| Crewe & Nantwich
|
|
Labour
|
5,030
|
5,128
|
1,277
|
840
|
976
|
719
|
13,970
|
|
Labour
|
| Crosby
|
|
Labour
|
5,565
|
3,825
|
1,453
|
730
|
692
|
717
|
12,982
|
|
Conservative
|
| Denton & Reddish
|
|
Labour
|
3,003
|
4,741
|
1,008
|
650
|
811
|
699
|
10,912
|
|
Labour
|
| Eccles
|
|
Labour
|
2,969
|
5,383
|
984
|
625
|
740
|
738
|
11,439
|
|
Labour
|
| Eddisbury
|
|
Conservative
|
8,024
|
3,693
|
2,132
|
760
|
1,179
|
890
|
16,678
|
|
Conservative
|
| Ellesmere Port & Neston
|
|
Labour
|
5,178
|
5,600
|
1,127
|
707
|
1,038
|
797
|
14,447
|
|
Labour
|
| Fylde
|
|
Conservative
|
9,422
|
3,571
|
1,796
|
785
|
1,539
|
977
|
18,090
|
|
Conservative
|
| Halton
|
|
Labour
|
2,919
|
5,052
|
956
|
536
|
578
|
562
|
10,603
|
|
Labour
|
| Hazel Grove
|
|
Liberal Democrat
|
4,934
|
2,940
|
4,459
|
855
|
1,469
|
1,031
|
15,688
|
|
Conservative
|
| Heywood & Middleton
|
|
Labour
|
4,464
|
4,743
|
1,453
|
620
|
872
|
786
|
12,938
|
|
Labour
|
| Hyndburn
|
|
Labour
|
5,292
|
4,401
|
990
|
767
|
1,077
|
1,209
|
13,736
|
|
Conservative
|
| Knowsley North & Sefton East
|
|
Labour
|
2,835
|
4,277
|
1,216
|
462
|
540
|
631
|
9,961
|
|
Labour
|
| Knowsley South
|
|
Labour
|
2,010
|
5,089
|
851
|
549
|
451
|
682
|
9,632
|
|
Labour
|
| Lancaster & Wyre
|
|
Labour
|
9,481
|
5,080
|
1,871
|
2,432
|
1,571
|
1,091
|
21,526
|
|
Conservative
|
| Leigh
|
|
Labour
|
2,445
|
5,525
|
762
|
692
|
639
|
536
|
10,599
|
|
Labour
|
| Liverpool, Garston
|
|
Labour
|
3,138
|
3,397
|
2,237
|
595
|
443
|
672
|
10,482
|
|
Labour
|
| Liverpool, Riverside
|
|
Labour
|
1,157
|
3,495
|
1,197
|
829
|
210
|
631
|
7,519
|
|
Labour
|
| Liverpool, Walton
|
|
Labour
|
1,076
|
3,459
|
1,323
|
314
|
297
|
668
|
7,137
|
|
Labour
|
| Liverpool, Wavertree
|
|
Labour
|
2,311
|
3,776
|
2,255
|
632
|
425
|
785
|
10,184
|
|
Labour
|
| Liverpool, West Derby
|
|
Labour
|
1,545
|
3,290
|
1,110
|
380
|
282
|
1,083
|
7,690
|
|
Labour
|
| Macclesfield
|
|
Conservative
|
7,528
|
3,851
|
2,155
|
984
|
1,333
|
888
|
16,739
|
|
Conservative
|
| Makerfield
|
|
Labour
|
2,001
|
4,775
|
551
|
477
|
622
|
465
|
8,891
|
|
Labour
|
| Manchester, Blackley
|
|
Labour
|
2,037
|
4,534
|
827
|
452
|
512
|
666
|
9,028
|
|
Labour
|
| Manchester, Central
|
|
Labour
|
1,184
|
4,299
|
820
|
702
|
305
|
643
|
7,953
|
|
Labour
|
| Manchester, Gorton
|
|
Labour
|
1,307
|
3,942
|
1,347
|
794
|
351
|
751
|
8,492
|
|
Labour
|
| Manchester, Withington
|
|
Labour
|
2,673
|
4,766
|
2,042
|
1,537
|
465
|
750
|
12,233
|
|
Labour
|
| Morecambe & Lunesdale
|
|
Labour
|
6,895
|
4,282
|
1,573
|
1,201
|
1,674
|
992
|
16,617
|
|
Conservative
|
| Oldham East & Saddleworth
|
|
Labour
|
4,399
|
4,031
|
4,974
|
855
|
1,054
|
1,223
|
16,536
|
|
Liberal Democrat
|
| Oldham West & Royton
|
|
Labour
|
3,816
|
4,675
|
1,612
|
608
|
894
|
1,350
|
12,955
|
|
Labour
|
| Pendle
|
|
Labour
|
5,170
|
4,612
|
1,250
|
871
|
1,494
|
1,363
|
14,760
|
|
Conservative
|
| Penrith & The Border
|
|
Conservative
|
10,320
|
3,161
|
1,971
|
982
|
1,391
|
1,206
|
19,031
|
|
Conservative
|
| Preston
|
|
Labour
|
3,608
|
4,967
|
1,065
|
741
|
630
|
962
|
11,973
|
|
Labour
|
| Ribble Valley
|
|
Conservative
|
10,259
|
3,581
|
2,723
|
1,039
|
1,393
|
1,259
|
20,254
|
|
Conservative
|
| Rochdale
|
|
Labour
|
3,528
|
4,804
|
3,660
|
762
|
760
|
1,167
|
14,681
|
|
Labour
|
| Rossendale & Darwen
|
|
Labour
|
5,854
|
4,915
|
1,449
|
926
|
1,093
|
1,081
|
15,318
|
|
Conservative
|
| Salford
|
|
Labour
|
1,887
|
3,753
|
748
|
399
|
385
|
608
|
7,780
|
|
Labour
|
| South Ribble
|
|
Labour
|
6,370
|
4,439
|
1,740
|
775
|
1,161
|
910
|
15,395
|
|
Conservative
|
| Southport
|
|
Liberal Democrat
|
6,780
|
2,995
|
3,020
|
767
|
888
|
834
|
15,284
|
|
Conservative
|
| St Helens North
|
|
Labour
|
3,073
|
4,957
|
1,024
|
495
|
649
|
566
|
10,764
|
|
Labour
|
| St Helens South
|
|
Labour
|
2,483
|
4,177
|
1,137
|
388
|
509
|
542
|
9,236
|
|
Labour
|
| Stalybridge & Hyde
|
|
Labour
|
3,535
|
3,892
|
1,039
|
785
|
818
|
832
|
10,901
|
|
Labour
|
| Stockport
|
|
Labour
|
3,635
|
4,933
|
1,415
|
879
|
1,092
|
678
|
12,632
|
|
Labour
|
| Stretford & Urmston
|
|
Labour
|
4,798
|
5,605
|
789
|
686
|
952
|
576
|
13,406
|
|
Labour
|
| Tatton
|
|
Independent
|
9,008
|
3,260
|
2,214
|
884
|
1,193
|
907
|
17,466
|
|
Conservative
|
| Wallasey
|
|
Labour
|
4,020
|
4,718
|
863
|
759
|
803
|
671
|
11,834
|
|
Labour
|
| Warrington North
|
|
Labour
|
3,682
|
6,033
|
1,196
|
731
|
859
|
706
|
13,207
|
|
Labour
|
| Warrington South
|
|
Labour
|
5,531
|
5,426
|
2,365
|
826
|
1,063
|
793
|
16,004
|
|
Conservative
|
| Weaver Vale
|
|
Labour
|
4,590
|
4,626
|
1,551
|
793
|
930
|
744
|
13,234
|
|
Labour
|
| West Lancashire
|
|
Labour
|
5,859
|
5,612
|
1,166
|
873
|
999
|
1,054
|
15,563
|
|
Conservative
|
| Westmorland & Lonsdale
|
|
Conservative
|
9,297
|
3,377
|
4,485
|
1,520
|
1,394
|
1,232
|
21,305
|
|
Conservative
|
| Wigan
|
|
Labour
|
2,552
|
4,642
|
760
|
616
|
551
|
580
|
9,701
|
|
Labour
|
| Wirral South
|
|
Labour
|
6,125
|
4,252
|
1,819
|
666
|
847
|
786
|
14,495
|
|
Conservative
|
| Wirral West
|
|
Labour
|
6,652
|
3,736
|
1,823
|
866
|
801
|
823
|
14,701
|
|
Conservative
|
| Workington
|
|
Labour
|
5,987
|
9,035
|
1,224
|
727
|
895
|
959
|
18,827
|
|
Labour
|
| Worsley
|
|
Labour
|
3,219
|
4,701
|
1,289
|
577
|
727
|
688
|
11,201
|
|
Labour
|
| Wythenshawe & Sale East
|
|
Labour
|
3,601
|
5,450
|
1,208
|
737
|
800
|
689
|
12,485
|
|
Labour
|
South East[edit]
| Constituency
|
Party won in 1997
|
Con
|
Lab
|
Lib
|
Green
|
UKIP
|
Others
|
Total
|
Party won in 1999
|
| Aldershot
|
|
Conservative
|
6,834
|
2,890
|
3,064
|
938
|
1,731
|
512
|
15,969
|
|
Conservative
|
| Arundel and South Downs
|
|
Conservative
|
11,113
|
2,621
|
2,899
|
1,740
|
2,679
|
734
|
21,786
|
|
Conservative
|
| Ashford
|
|
Conservative
|
9,432
|
4,157
|
2,684
|
1,298
|
1,708
|
719
|
19,998
|
|
Conservative
|
| Aylesbury
|
|
Conservative
|
9,324
|
3,020
|
3,780
|
1,269
|
1,708
|
733
|
19,834
|
|
Conservative
|
| Banbury
|
|
Conservative
|
8,542
|
3,869
|
2,473
|
1,517
|
1,582
|
654
|
18,637
|
|
Conservative
|
| Basingstoke
|
|
Conservative
|
6,888
|
3,999
|
2,503
|
1,078
|
1,518
|
694
|
16,680
|
|
Conservative
|
| Beaconsfield
|
|
Conservative
|
8,918
|
2,359
|
2,163
|
1,038
|
1,867
|
712
|
17,057
|
|
Conservative
|
| Bexhill and Battle
|
|
Conservative
|
11,183
|
2,875
|
3,004
|
1,472
|
3,243
|
611
|
22,388
|
|
Conservative
|
| Bognor Regis and Littlehampton
|
|
Conservative
|
8,370
|
2,952
|
2,189
|
1,074
|
2,819
|
451
|
17,855
|
|
Conservative
|
| Bracknell
|
|
Conservative
|
8,646
|
4,596
|
2,947
|
1,192
|
1,499
|
729
|
19,609
|
|
Conservative
|
| Brighton, Kemptown
|
|
Labour
|
5,871
|
4,125
|
1,515
|
1,663
|
1,254
|
575
|
15,003
|
|
Conservative
|
| Brighton, Pavilion
|
|
Labour
|
4,742
|
5,263
|
1,440
|
3,084
|
1,016
|
687
|
16,232
|
|
Labour
|
| Buckingham
|
|
Conservative
|
9,330
|
3,022
|
2,979
|
1,394
|
1,750
|
690
|
19,165
|
|
Conservative
|
| Canterbury
|
|
Conservative
|
8,149
|
4,229
|
3,021
|
1,814
|
1,501
|
732
|
19,446
|
|
Conservative
|
| Chatham and Aylesford
|
|
Labour
|
4,759
|
3,644
|
1,735
|
693
|
1,119
|
414
|
12,364
|
|
Conservative
|
| Chesham and Amersham
|
|
Conservative
|
9,742
|
2,575
|
3,162
|
1,340
|
2,012
|
813
|
19,644
|
|
Conservative
|
| Chichester
|
|
Conservative
|
11,631
|
2,824
|
3,724
|
1,666
|
3,633
|
604
|
24,082
|
|
Conservative
|
| Crawley
|
|
Labour
|
4,625
|
5,466
|
1,395
|
1,040
|
1,995
|
460
|
14,981
|
|
Labour
|
| Dartford
|
|
Labour
|
5,940
|
4,928
|
1,382
|
1,030
|
1,459
|
503
|
15,242
|
|
Conservative
|
| Dover
|
|
Labour
|
7,163
|
6,267
|
1,486
|
1,094
|
1,643
|
686
|
18,339
|
|
Conservative
|
| East Hampshire
|
|
Conservative
|
10,943
|
3,001
|
3,552
|
1,629
|
1,828
|
795
|
21,748
|
|
Conservative
|
| East Surrey
|
|
Conservative
|
10,486
|
2,811
|
3,668
|
1,303
|
2,378
|
794
|
21,440
|
|
Conservative
|
| East Worthing and Shoreham
|
|
Conservative
|
8,740
|
3,780
|
2,216
|
1,462
|
1,873
|
500
|
18,571
|
|
Conservative
|
| Eastbourne
|
|
Conservative
|
11,158
|
3,216
|
3,351
|
1,464
|
1,904
|
566
|
21,659
|
|
Conservative
|
| Eastleigh
|
|
Liberal Democrat
|
5,946
|
3,674
|
3,689
|
1,111
|
1,833
|
437
|
16,690
|
|
Conservative
|
| Epsom and Ewell
|
|
Conservative
|
8,848
|
3,084
|
2,495
|
1,282
|
2,046
|
674
|
18,429
|
|
Conservative
|
| Esher and Walton
|
|
Conservative
|
9,213
|
3,163
|
2,437
|
1,603
|
1,793
|
843
|
19,052
|
|
Conservative
|
| Fareham
|
|
Conservative
|
7,991
|
2,930
|
2,492
|
1,064
|
1,951
|
551
|
16,979
|
|
Conservative
|
| Faversham and Mid Kent
|
|
Conservative
|
7,506
|
3,547
|
1,889
|
1,224
|
1,318
|
586
|
16,070
|
|
Conservative
|
| Folkestone and Hythe
|
|
Conservative
|
9,115
|
3,547
|
2,364
|
1,031
|
1,767
|
602
|
18,426
|
|
Conservative
|
| Gillingham and Rainham
|
|
Labour
|
5,565
|
4,157
|
2,011
|
946
|
1,858
|
554
|
15,091
|
|
Conservative
|
| Gosport
|
|
Conservative
|
7,465
|
2,788
|
2,145
|
949
|
1,732
|
495
|
15,574
|
|
Conservative
|
| Gravesham
|
|
Labour
|
6,052
|
5,093
|
1,126
|
919
|
1,204
|
522
|
14,916
|
|
Conservative
|
| Guildford
|
|
Conservative
|
8,841
|
3,496
|
4,310
|
1,637
|
2,022
|
791
|
21,097
|
|
Conservative
|
| Hastings and Rye
|
|
Labour
|
6,491
|
4,401
|
2,397
|
1,531
|
2,137
|
518
|
17,475
|
|
Conservative
|
| Havant
|
|
Conservative
|
7,427
|
3,033
|
2,221
|
962
|
1,268
|
492
|
15,403
|
|
Conservative
|
| Henley
|
|
Conservative
|
8,312
|
2,900
|
3,158
|
1,596
|
1,592
|
746
|
18,304
|
|
Conservative
|
| Horsham
|
|
Conservative
|
10,306
|
2,788
|
3,373
|
1,475
|
2,390
|
750
|
21,082
|
|
Conservative
|
| Hove
|
|
Labour
|
6,603
|
3,976
|
1,499
|
1,782
|
1,283
|
540
|
15,683
|
|
Conservative
|
| Isle of Wight
|
|
Liberal Democrat
|
12,045
|
5,078
|
4,816
|
2,401
|
3,336
|
855
|
28,531
|
|
Conservative
|
| Lewes
|
|
Liberal Democrat
|
9,113
|
2,978
|
3,715
|
2,199
|
1,772
|
625
|
20,402
|
|
Conservative
|
| Maidenhead
|
|
Conservative
|
8,415
|
2,867
|
3,293
|
1,294
|
1,346
|
966
|
18,181
|
|
Conservative
|
| Maidstone and The Weald
|
|
Conservative
|
7,878
|
3,252
|
2,997
|
1,275
|
1,761
|
628
|
17,791
|
|
Conservative
|
| Medway
|
|
Labour
|
4,932
|
4,192
|
1,329
|
1,026
|
1,286
|
594
|
13,359
|
|
Conservative
|
| Mid Sussex
|
|
Conservative
|
8,788
|
2,710
|
3,508
|
1,471
|
1,963
|
718
|
19,158
|
|
Conservative
|
| Milton Keynes South West
|
|
Labour
|
4,712
|
4,888
|
1,839
|
1,009
|
1,164
|
477
|
14,089
|
|
Labour
|
| Mole Valley
|
|
Conservative
|
10,990
|
3,004
|
3,866
|
1,650
|
2,136
|
816
|
22,462
|
|
Conservative
|
| New Forest East
|
|
Conservative
|
7,129
|
2,697
|
2,580
|
1,004
|
1,688
|
547
|
15,645
|
|
Conservative
|
| New Forest West
|
|
Conservative
|
12,176
|
2,689
|
2,605
|
1,225
|
2,649
|
554
|
21,898
|
|
Conservative
|
| Newbury
|
|
Liberal Democrat
|
8,973
|
2,114
|
5,760
|
1,323
|
1,491
|
605
|
20,266
|
|
Conservative
|
| North East Hampshire
|
|
Conservative
|
10,106
|
2,406
|
2,832
|
1,163
|
1,875
|
802
|
19,184
|
|
Conservative
|
| North East Milton Keynes
|
|
Labour
|
5,822
|
3,909
|
3,337
|
1,144
|
1,317
|
471
|
16,000
|
|
Conservative
|
| North Thanet
|
|
Conservative
|
7,526
|
3,901
|
1,638
|
933
|
1,741
|
685
|
16,424
|
|
Conservative
|
| North West Hampshire
|
|
Conservative
|
9,161
|
3,084
|
3,028
|
1,059
|
2,023
|
729
|
19,084
|
|
Conservative
|
| Oxford East
|
|
Labour
|
3,087
|
4,227
|
2,345
|
2,275
|
949
|
480
|
13,363
|
|
Labour
|
| Oxford West and Abingdon
|
|
Liberal Democrat
|
7,084
|
3,852
|
5,684
|
2,302
|
1,294
|
756
|
20,972
|
|
Conservative
|
| Portsmouth North
|
|
Labour
|
5,388
|
4,064
|
1,307
|
669
|
1,055
|
356
|
12,839
|
|
Conservative
|
| Portsmouth South
|
|
Liberal Democrat
|
5,761
|
3,815
|
2,645
|
1,063
|
1,071
|
531
|
14,886
|
|
Conservative
|
| Reading East
|
|
Labour
|
5,412
|
4,497
|
2,799
|
1,466
|
898
|
608
|
15,680
|
|
Conservative
|
| Reading West
|
|
Labour
|
4,949
|
4,597
|
1,819
|
971
|
884
|
572
|
13,792
|
|
Conservative
|
| Reigate
|
|
Conservative
|
8,335
|
2,968
|
2,456
|
1,245
|
1,666
|
612
|
17,282
|
|
Conservative
|
| Romsey
|
|
Conservative
|
9,268
|
2,850
|
3,547
|
1,348
|
2,039
|
625
|
19,677
|
|
Conservative
|
| Runnymede and Weybridge
|
|
Conservative
|
8,100
|
2,872
|
1,882
|
1,189
|
1,770
|
697
|
16,510
|
|
Conservative
|
| Sevenoaks
|
|
Conservative
|
8,915
|
2,897
|
2,641
|
1,187
|
1,540
|
827
|
18,007
|
|
Conservative
|
| Sittingbourne and Sheppey
|
|
Labour
|
4,637
|
3,436
|
1,619
|
637
|
1,357
|
450
|
12,136
|
|
Conservative
|
| Slough
|
|
Labour
|
3,523
|
4,144
|
1,212
|
766
|
865
|
416
|
10,926
|
|
Labour
|
| South Thanet
|
|
Conservative
|
6,758
|
4,128
|
1,722
|
902
|
1,427
|
664
|
15,601
|
|
Conservative
|
| South West Surrey
|
|
Conservative
|
10,308
|
2,563
|
4,231
|
1,729
|
2,201
|
838
|
21,870
|
|
Conservative
|
| Southampton Itchen
|
|
Labour
|
4,530
|
4,621
|
2,025
|
918
|
1,233
|
390
|
13,717
|
|
Labour
|
| Southampton Test
|
|
Labour
|
4,366
|
4,539
|
2,454
|
1,309
|
1,175
|
454
|
14,297
|
|
Labour
|
| Spelthorne
|
|
Conservative
|
7,976
|
3,479
|
1,628
|
1,100
|
1,498
|
510
|
16,191
|
|
Conservative
|
| Surrey Heath
|
|
Conservative
|
8,232
|
2,669
|
2,556
|
1,017
|
1,836
|
691
|
17,001
|
|
Conservative
|
| Tonbridge and Malling
|
|
Conservative
|
8,168
|
3,199
|
2,384
|
1,208
|
1,715
|
674
|
17,348
|
|
Conservative
|
| Tunbridge Wells
|
|
Conservative
|
7,512
|
2,701
|
2,882
|
1,249
|
1,476
|
680
|
16,500
|
|
Conservative
|
| Wantage
|
|
Conservative
|
8,120
|
4,001
|
3,876
|
1,591
|
1,695
|
677
|
19,960
|
|
Conservative
|
| Wealden
|
|
Conservative
|
11,719
|
2,892
|
3,365
|
1,809
|
2,504
|
770
|
23,059
|
|
Conservative
|
| Winchester
|
|
Liberal Democrat
|
11,615
|
3,397
|
6,708
|
1,939
|
2,081
|
747
|
26,487
|
|
Conservative
|
| Windsor
|
|
Conservative
|
8,342
|
2,931
|
2,729
|
1,193
|
1,315
|
717
|
17,227
|
|
Conservative
|
| Witney
|
|
Conservative
|
9,343
|
4,027
|
3,430
|
1,871
|
2,310
|
675
|
21,656
|
|
Conservative
|
| Woking
|
|
Conservative
|
9,282
|
3,346
|
3,258
|
1,210
|
1,849
|
741
|
19,686
|
|
Conservative
|
| Wokingham
|
|
Conservative
|
7,065
|
2,455
|
3,130
|
1,145
|
1,233
|
792
|
15,820
|
|
Conservative
|
| Worthing West
|
|
Conservative
|
10,841
|
2,707
|
2,745
|
1,436
|
2,578
|
543
|
20,850
|
|
Conservative
|
| Wycombe
|
|
Conservative
|
7,305
|
3,436
|
1,976
|
1,247
|
1,537
|
737
|
16,238
|
|
Conservative
|
South West[edit]
| Constituency
|
Party won in 1997
|
Con
|
Lab
|
Lib
|
Green
|
UKIP
|
Others
|
Total
|
Party won in 1999
|
| Bath
|
|
Liberal Democrat
|
7,078
|
3,377
|
4,591
|
2,167
|
1,233
|
839
|
19,285
|
|
Conservative
|
| Bournemouth East
|
|
Conservative
|
6,769
|
2,281
|
1,912
|
1,171
|
1,901
|
744
|
14,778
|
|
Conservative
|
| Bournemouth West
|
|
Conservative
|
6,871
|
2,549
|
1,551
|
966
|
1,644
|
676
|
14,257
|
|
Conservative
|
| Bridgwater
|
|
Conservative
|
9,535
|
3,765
|
3,183
|
1,758
|
1,645
|
973
|
20,859
|
|
Conservative
|
| Bristol East
|
|
Labour
|
3,879
|
5,077
|
2,002
|
1,282
|
911
|
729
|
13,880
|
|
Labour
|
| Bristol North West
|
|
Labour
|
5,275
|
5,656
|
1,654
|
1,129
|
1,208
|
684
|
15,606
|
|
Labour
|
| Bristol South
|
|
Labour
|
3,807
|
5,071
|
1,298
|
1,290
|
889
|
678
|
13,033
|
|
Labour
|
| Bristol West
|
|
Labour
|
8,112
|
5,340
|
4,993
|
3,288
|
999
|
1,027
|
23,759
|
|
Conservative
|
| Cheltenham
|
|
Liberal Democrat
|
7,550
|
2,731
|
2,766
|
1,318
|
1,359
|
857
|
16,581
|
|
Conservative
|
| Christchurch
|
|
Conservative
|
14,042
|
2,844
|
2,507
|
1,172
|
2,221
|
890
|
23,676
|
|
Conservative
|
| Cotswold
|
|
Conservative
|
10,959
|
3,243
|
2,785
|
1,804
|
2,210
|
917
|
21,918
|
|
Conservative
|
| Devizes
|
|
Conservative
|
10,710
|
3,462
|
3,334
|
1,780
|
2,229
|
995
|
22,510
|
|
Conservative
|
| East Devon
|
|
Conservative
|
11,723
|
2,822
|
3,344
|
1,973
|
2,762
|
1,165
|
23,789
|
|
Conservative
|
| Exeter
|
|
Labour
|
6,404
|
6,286
|
3,075
|
2,171
|
2,299
|
1,812
|
22,047
|
|
Conservative
|
| Falmouth & Camborne
|
|
Labour
|
6,502
|
3,610
|
3,719
|
1,306
|
2,880
|
994
|
19,011
|
|
Conservative
|
| Forest of Dean
|
|
Labour
|
6,886
|
4,615
|
1,733
|
1,830
|
1,425
|
694
|
17,183
|
|
Conservative
|
| Gloucester
|
|
Labour
|
6,879
|
4,880
|
1,619
|
1,116
|
1,271
|
855
|
16,620
|
|
Conservative
|
| Kingswood
|
|
Labour
|
6,436
|
6,955
|
2,174
|
1,256
|
1,284
|
750
|
18,855
|
|
Labour
|
| Mid Dorset & North Poole
|
|
Conservative
|
8,612
|
2,685
|
3,397
|
1,115
|
1,589
|
968
|
18,366
|
|
Conservative
|
| North Cornwall
|
|
Liberal Democrat
|
8,586
|
1,933
|
6,720
|
1,614
|
4,118
|
1,409
|
24,380
|
|
Conservative
|
| North Devon
|
|
Liberal Democrat
|
8,882
|
2,382
|
4,335
|
1,850
|
3,664
|
1,240
|
22,353
|
|
Conservative
|
| North Dorset
|
|
Conservative
|
11,645
|
2,544
|
3,567
|
1,852
|
2,265
|
1,029
|
22,902
|
|
Conservative
|
| North Swindon
|
|
Labour
|
4,600
|
4,138
|
1,361
|
882
|
1,062
|
583
|
12,626
|
|
Conservative
|
| North Wiltshire
|
|
Conservative
|
10,027
|
3,130
|
3,952
|
1,917
|
2,150
|
958
|
22,134
|
|
Conservative
|
| Northavon
|
|
Labour
|
8,818
|
3,828
|
5,472
|
1,403
|
1,384
|
1,051
|
21,956
|
|
Conservative
|
| Plymouth, Devonport
|
|
Labour
|
5,001
|
5,668
|
1,935
|
966
|
1,714
|
874
|
16,158
|
|
Labour
|
| Plymouth, Sutton
|
|
Labour
|
5,902
|
5,025
|
2,387
|
1,501
|
1,531
|
914
|
17,260
|
|
Conservative
|
| Poole
|
|
Conservative
|
8,553
|
2,945
|
2,149
|
1,181
|
1,560
|
835
|
17,223
|
|
Conservative
|
| Salisbury
|
|
Conservative
|
11,123
|
3,661
|
3,259
|
1,769
|
3,792
|
935
|
24,539
|
|
Conservative
|
| Somerton & Frome
|
|
Liberal Democrat
|
11,547
|
2,588
|
5,264
|
1,938
|
1,804
|
1,132
|
24,273
|
|
Conservative
|
| South Dorset
|
|
Conservative
|
8,009
|
3,736
|
2,825
|
1,475
|
2,216
|
933
|
19,194
|
|
Conservative
|
| South East Cornwall
|
|
Liberal Democrat
|
8,572
|
2,540
|
6,645
|
1,750
|
3,367
|
1,249
|
24,123
|
|
Conservative
|
| South Swindon
|
|
Labour
|
5,470
|
4,034
|
1,961
|
1,160
|
1,091
|
637
|
14,353
|
|
Conservative
|
| South West Devon
|
|
Conservative
|
9,300
|
3,803
|
3,079
|
1,475
|
2,210
|
1,004
|
20,871
|
|
Conservative
|
| St Ives
|
|
Liberal Democrat
|
7,373
|
3,009
|
5,205
|
1,895
|
3,401
|
1,017
|
21,900
|
|
Conservative
|
| Stroud
|
|
Labour
|
9,284
|
5,578
|
3,210
|
2,872
|
1,867
|
1,067
|
23,878
|
|
Conservative
|
| Taunton
|
|
Liberal Democrat
|
11,173
|
3,697
|
4,454
|
2,128
|
2,005
|
1,147
|
24,604
|
|
Conservative
|
| Teignbridge
|
|
Conservative
|
9,906
|
3,814
|
3,716
|
2,147
|
3,948
|
1,138
|
24,669
|
|
Conservative
|
| Tewkesbury
|
|
Conservative
|
8,683
|
3,541
|
2,284
|
1,470
|
1,828
|
906
|
18,712
|
|
Conservative
|
| Tiverton & Honiton
|
|
Conservative
|
10,592
|
3,075
|
4,179
|
2,276
|
3,168
|
1,365
|
24,655
|
|
Conservative
|
| Torbay
|
|
Liberal Democrat
|
8,774
|
3,535
|
3,224
|
1,313
|
3,285
|
956
|
21,087
|
|
Conservative
|
| Torridge & West Devon
|
|
Liberal Democrat
|
10,342
|
2,809
|
4,265
|
2,637
|
5,045
|
1,140
|
26,238
|
|
Conservative
|
| Totnes
|
|
Conservative
|
9,995
|
3,510
|
3,127
|
2,555
|
3,865
|
1,107
|
24,159
|
|
Conservative
|
| Truro & St Austell
|
|
Liberal Democrat
|
8,366
|
2,494
|
6,001
|
1,547
|
3,317
|
1,257
|
22,982
|
|
Conservative
|
| Wansdyke
|
|
Labour
|
7,053
|
4,972
|
2,444
|
1,494
|
1,547
|
825
|
18,335
|
|
Conservative
|
| Wells
|
|
Conservative
|
11,374
|
3,136
|
3,962
|
2,280
|
1,690
|
1,061
|
23,503
|
|
Conservative
|
| West Dorset
|
|
Conservative
|
10,683
|
3,207
|
3,699
|
2,243
|
2,561
|
1,236
|
23,629
|
|
Conservative
|
| Westbury
|
|
Conservative
|
10,139
|
3,141
|
3,744
|
2,092
|
2,177
|
1,128
|
22,421
|
|
Conservative
|
| Weston-Super-Mare
|
|
Liberal Democrat
|
8,818
|
3,620
|
2,815
|
1,655
|
1,627
|
893
|
19,428
|
|
Conservative
|
| Woodspring
|
|
Conservative
|
9,720
|
3,631
|
3,522
|
1,804
|
1,627
|
934
|
21,238
|
|
Conservative
|
| Yeovil
|
|
Liberal Democrat
|
8,306
|
2,389
|
5,099
|
1,597
|
2,167
|
1,033
|
20,591
|
|
Conservative
|
West Midlands[edit]
| Constituency
|
Party won in 1997
|
Con
|
Lab
|
Lib
|
Green
|
UKIP
|
Others
|
Total
|
Party won in 1999
|
| Aldridge-Brownhills
|
|
Conservative
|
6,265
|
3,139
|
1,437
|
608
|
853
|
1,011
|
13,313
|
|
Conservative
|
| Birmingham, Edgbaston
|
|
Labour
|
6,117
|
4,193
|
1,587
|
871
|
548
|
1,209
|
14,525
|
|
Conservative
|
| Birmingham, Erdington
|
|
Labour
|
2,828
|
3,886
|
1,078
|
539
|
443
|
1,074
|
9,848
|
|
Labour
|
| Birmingham, Hall Green
|
|
Labour
|
4,460
|
3,852
|
1,795
|
675
|
648
|
1,144
|
12,574
|
|
Conservative
|
| Birmingham, Hodge Hill
|
|
Labour
|
2,373
|
3,424
|
943
|
321
|
372
|
957
|
8,390
|
|
Labour
|
| Birmingham, Ladywood
|
|
Labour
|
1,789
|
5,836
|
1,186
|
564
|
272
|
1,393
|
11,040
|
|
Labour
|
| Birmingham, Northfield
|
|
Labour
|
3,270
|
3,387
|
1,281
|
574
|
505
|
957
|
9,974
|
|
Labour
|
| Birmingham, Perry Barr
|
|
Labour
|
3,294
|
5,795
|
1,138
|
660
|
489
|
1,802
|
13,178
|
|
Labour
|
| Birmingham, Selly Oak
|
|
Labour
|
4,483
|
4,954
|
2,207
|
1,467
|
647
|
1,552
|
15,310
|
|
Labour
|
| Birmingham, Sparkbrook & Small Heath
|
|
Labour
|
2,233
|
5,160
|
1,912
|
746
|
344
|
1,451
|
11,846
|
|
Labour
|
| Birmingham, Yardley
|
|
Labour
|
2,470
|
2,640
|
2,874
|
332
|
477
|
931
|
9,724
|
|
Liberal Democrat
|
| Bromsgrove
|
|
Conservative
|
8,549
|
3,572
|
1,605
|
1,073
|
1,165
|
1,317
|
17,281
|
|
Conservative
|
| Burton
|
|
Labour
|
6,279
|
4,113
|
1,242
|
671
|
1,022
|
1,198
|
14,525
|
|
Conservative
|
| Cannock Chase
|
|
Labour
|
4,076
|
4,356
|
976
|
565
|
700
|
994
|
11,667
|
|
Labour
|
| Coventry North East
|
|
Labour
|
2,527
|
4,420
|
795
|
437
|
387
|
4,515
|
13,081
|
|
Labour
|
| Coventry North West
|
|
Labour
|
4,231
|
4,149
|
1,036
|
734
|
570
|
5,466
|
16,186
|
|
Conservative
|
| Coventry South
|
|
Labour
|
4,814
|
3,654
|
1,013
|
658
|
533
|
5,284
|
15,956
|
|
Conservative
|
| Dudley North
|
|
Labour
|
4,610
|
4,345
|
787
|
460
|
643
|
1,060
|
11,905
|
|
Conservative
|
| Dudley South
|
|
Labour
|
3,794
|
3,757
|
1,431
|
406
|
641
|
946
|
10,975
|
|
Conservative
|
| Halesowen & Rowley Regis
|
|
Labour
|
4,724
|
4,511
|
1,084
|
652
|
816
|
1,126
|
12,913
|
|
Conservative
|
| Hereford
|
|
Liberal Democrat
|
7,827
|
3,286
|
2,883
|
1,797
|
1,853
|
1,660
|
19,306
|
|
Conservative
|
| Leominster
|
|
Conservative
|
10,090
|
3,268
|
2,739
|
3,130
|
2,081
|
1,886
|
23,194
|
|
Conservative
|
| Lichfield
|
|
Conservative
|
7,167
|
4,110
|
1,722
|
839
|
907
|
1,006
|
15,751
|
|
Conservative
|
| Ludlow
|
|
Conservative
|
7,947
|
3,286
|
2,514
|
1,686
|
1,297
|
1,738
|
18,468
|
|
Conservative
|
| Meriden
|
|
Conservative
|
7,409
|
2,931
|
1,755
|
648
|
953
|
2,032
|
15,728
|
|
Conservative
|
| Mid Worcestershire
|
|
Conservative
|
9,204
|
2,916
|
2,316
|
1,143
|
1,225
|
1,596
|
18,400
|
|
Conservative
|
| Newcastle-under-Lyme
|
|
Labour
|
4,350
|
5,117
|
2,203
|
842
|
683
|
1,408
|
14,603
|
|
Labour
|
| North Shropshire
|
|
Conservative
|
8,550
|
4,009
|
1,531
|
1,315
|
1,271
|
1,752
|
18,428
|
|
Conservative
|
| North Warwickshire
|
|
Labour
|
5,011
|
4,419
|
1,117
|
709
|
798
|
2,553
|
14,607
|
|
Conservative
|
| Nuneaton
|
|
Labour
|
5,198
|
4,338
|
1,124
|
694
|
768
|
2,877
|
14,999
|
|
Conservative
|
| Redditch
|
|
Labour
|
4,766
|
3,317
|
1,395
|
655
|
778
|
985
|
11,896
|
|
Conservative
|
| Rugby & Kenilworth
|
|
Labour
|
8,076
|
4,646
|
1,958
|
1,181
|
1,230
|
3,370
|
20,461
|
|
Conservative
|
| Shrewsbury & Atcham
|
|
Labour
|
7,825
|
4,533
|
2,595
|
1,515
|
1,243
|
1,714
|
19,425
|
|
Conservative
|
| Solihull
|
|
Conservative
|
9,448
|
2,927
|
2,891
|
765
|
1,486
|
2,177
|
19,694
|
|
Conservative
|
| South Staffordshire
|
|
Conservative
|
7,351
|
3,025
|
1,198
|
737
|
995
|
1,149
|
14,455
|
|
Conservative
|
| Stafford
|
|
Labour
|
6,636
|
4,694
|
1,591
|
863
|
892
|
1,596
|
16,272
|
|
Conservative
|
| Staffordshire Moorlands
|
|
Labour
|
5,172
|
4,231
|
1,838
|
655
|
756
|
1,216
|
13,868
|
|
Conservative
|
| Stoke-on-Trent Central
|
|
Labour
|
2,136
|
4,050
|
1,568
|
442
|
447
|
1,122
|
9,765
|
|
Labour
|
| Stoke-on-Trent North
|
|
Labour
|
2,589
|
3,545
|
1,235
|
368
|
528
|
1,100
|
9,365
|
|
Labour
|
| Stoke-on-Trent South
|
|
Labour
|
3,408
|
4,231
|
1,521
|
488
|
748
|
1,390
|
11,786
|
|
Labour
|
| Stone
|
|
Conservative
|
8,304
|
3,754
|
1,728
|
974
|
1,027
|
1,466
|
17,253
|
|
Conservative
|
| Stourbridge
|
|
Labour
|
5,353
|
3,841
|
1,818
|
660
|
971
|
1,119
|
13,762
|
|
Conservative
|
| Stratford-on-Avon
|
|
Conservative
|
12,033
|
3,350
|
3,909
|
1,381
|
1,578
|
2,003
|
24,254
|
|
Conservative
|
| Sutton Coldfield
|
|
Conservative
|
9,077
|
2,687
|
2,081
|
1,056
|
1,337
|
1,364
|
17,602
|
|
Conservative
|
| Tamworth
|
|
Labour
|
5,221
|
4,491
|
1,056
|
702
|
839
|
949
|
13,258
|
|
Conservative
|
| Telford
|
|
Labour
|
2,902
|
4,438
|
1,018
|
698
|
641
|
1,047
|
10,744
|
|
Labour
|
| The Wrekin
|
|
Labour
|
6,392
|
4,902
|
1,818
|
914
|
983
|
1,421
|
16,430
|
|
Conservative
|
| Walsall North
|
|
Labour
|
2,855
|
3,007
|
1,050
|
311
|
522
|
893
|
8,638
|
|
Labour
|
| Walsall South
|
|
Labour
|
4,343
|
4,132
|
906
|
541
|
647
|
1,056
|
11,625
|
|
Conservative
|
| Warley
|
|
Labour
|
2,895
|
4,898
|
777
|
613
|
477
|
1,131
|
10,791
|
|
Labour
|
| Warwick & Leamington
|
|
Labour
|
7,996
|
4,747
|
2,449
|
1,246
|
1,113
|
2,370
|
19,921
|
|
Conservative
|
| West Bromwich East
|
|
Labour
|
2,960
|
3,679
|
1,348
|
404
|
498
|
1,121
|
10,010
|
|
Labour
|
| West Bromwich West
|
|
Speaker
|
2,646
|
3,783
|
701
|
329
|
409
|
987
|
8,855
|
|
Labour
|
| West Worcestershire
|
|
Conservative
|
9,203
|
3,157
|
3,691
|
2,205
|
1,808
|
1,787
|
21,851
|
|
Conservative
|
| Wolverhampton North East
|
|
Labour
|
3,679
|
4,396
|
689
|
416
|
533
|
969
|
10,682
|
|
Labour
|
| Wolverhampton South East
|
|
Labour
|
2,407
|
4,371
|
739
|
300
|
381
|
845
|
9,043
|
|
Labour
|
| Wolverhampton South West
|
|
Labour
|
7,504
|
5,585
|
1,220
|
966
|
737
|
1,432
|
17,444
|
|
Conservative
|
| Worcester
|
|
Labour
|
5,457
|
4,169
|
1,741
|
1,195
|
1,100
|
1,425
|
15,087
|
|
Conservative
|
| Wyre Forest
|
|
Labour
|
7,146
|
4,262
|
1,929
|
1,044
|
1,006
|
1,365
|
16,752
|
|
Conservative
|
Yorkshire and the Humber[edit]
| Constituency
|
Party won in 1997
|
Con
|
Lab
|
Lib
|
Green
|
UKIP
|
Others
|
Total
|
Party won in 1999
|
| Barnsley Central
|
|
Labour
|
1,609
|
3,892
|
1,003
|
373
|
537
|
498
|
7,912
|
|
Labour
|
| Barnsley East & Mexborough
|
|
Labour
|
2,057
|
5,122
|
1,392
|
389
|
508
|
560
|
10,028
|
|
Labour
|
| Barnsley West & Penistone
|
|
Labour
|
3,241
|
4,683
|
1,462
|
689
|
786
|
686
|
11,547
|
|
Labour
|
| Batley & Spen
|
|
Labour
|
4,270
|
3,774
|
1,694
|
493
|
809
|
647
|
11,687
|
|
Conservative
|
| Beverley & Holderness
|
|
Conservative
|
7,666
|
3,895
|
2,625
|
869
|
1,629
|
756
|
17,440
|
|
Conservative
|
| Bradford North
|
|
Labour
|
4,287
|
3,763
|
1,936
|
551
|
760
|
832
|
12,129
|
|
Conservative
|
| Bradford South
|
|
Labour
|
4,008
|
3,932
|
1,329
|
549
|
847
|
801
|
11,466
|
|
Conservative
|
| Bradford West
|
|
Labour
|
4,886
|
4,619
|
1,123
|
810
|
688
|
1,051
|
13,177
|
|
Conservative
|
| Brigg & Goole
|
|
Labour
|
6,303
|
3,776
|
1,619
|
595
|
1,010
|
559
|
13,862
|
|
Conservative
|
| Calder Valley
|
|
Labour
|
6,189
|
4,129
|
2,468
|
1,330
|
1,356
|
864
|
16,336
|
|
Conservative
|
| Cleethorpes
|
|
Labour
|
5,938
|
3,870
|
1,445
|
693
|
991
|
625
|
13,562
|
|
Conservative
|
| Colne Valley
|
|
Labour
|
5,612
|
4,009
|
2,881
|
1,315
|
1,255
|
774
|
15,846
|
|
Conservative
|
| Dewsbury
|
|
Labour
|
3,867
|
3,856
|
1,580
|
500
|
790
|
767
|
11,360
|
|
Conservative
|
| Don Valley
|
|
Labour
|
4,559
|
4,223
|
1,350
|
529
|
802
|
536
|
11,999
|
|
Conservative
|
| Doncaster Central
|
|
Labour
|
3,557
|
4,619
|
1,562
|
492
|
852
|
472
|
11,554
|
|
Labour
|
| Doncaster North
|
|
Labour
|
2,344
|
4,428
|
1,023
|
409
|
635
|
406
|
9,245
|
|
Labour
|
| East Yorkshire
|
|
Conservative
|
8,769
|
3,268
|
2,137
|
785
|
1,646
|
626
|
17,231
|
|
Conservative
|
| Elmet
|
|
Labour
|
6,801
|
5,278
|
1,700
|
742
|
1,134
|
721
|
16,376
|
|
Conservative
|
| Great Grimsby
|
|
Labour
|
3,320
|
3,386
|
1,209
|
520
|
885
|
510
|
9,830
|
|
Labour
|
| Halifax
|
|
Labour
|
5,425
|
3,732
|
1,335
|
746
|
1,084
|
836
|
13,158
|
|
Conservative
|
| Haltemprice & Howden
|
|
Conservative
|
8,807
|
2,689
|
4,159
|
589
|
1,409
|
502
|
18,155
|
|
Conservative
|
| Harrogate & Knaresborough
|
|
Liberal Democrat
|
7,287
|
2,535
|
3,685
|
852
|
1,330
|
431
|
16,120
|
|
Conservative
|
| Hemsworth
|
|
Labour
|
2,931
|
4,792
|
1,010
|
486
|
642
|
570
|
10,431
|
|
Labour
|
| Huddersfield
|
|
Labour
|
3,438
|
3,853
|
1,701
|
1,231
|
845
|
698
|
11,766
|
|
Labour
|
| Keighley
|
|
Labour
|
7,167
|
5,171
|
1,744
|
1,065
|
1,234
|
930
|
17,311
|
|
Conservative
|
| Kingston upon Hull East
|
|
Labour
|
1,893
|
3,871
|
1,091
|
410
|
895
|
477
|
8,637
|
|
Labour
|
| Kingston upon Hull North
|
|
Labour
|
2,306
|
3,585
|
1,274
|
723
|
815
|
566
|
9,269
|
|
Labour
|
| Kingston upon Hull West & Hessle
|
|
Labour
|
2,459
|
3,317
|
1,559
|
458
|
776
|
498
|
9,067
|
|
Labour
|
| Leeds Central
|
|
Labour
|
1,969
|
6,120
|
2,795
|
694
|
558
|
867
|
13,003
|
|
Labour
|
| Leeds East
|
|
Labour
|
2,535
|
4,024
|
1,366
|
488
|
637
|
645
|
9,695
|
|
Labour
|
| Leeds North East
|
|
Labour
|
6,092
|
4,781
|
2,554
|
1,090
|
719
|
810
|
16,046
|
|
Conservative
|
| Leeds North West
|
|
Liberal Democrat
|
5,940
|
4,334
|
2,713
|
1,425
|
1,021
|
787
|
16,220
|
|
Conservative
|
| Leeds West
|
|
Labour
|
2,185
|
3,927
|
1,185
|
1,244
|
699
|
657
|
9,897
|
|
Labour
|
| Morley & Rothwell
|
|
Labour
|
3,446
|
4,433
|
1,361
|
572
|
894
|
692
|
11,398
|
|
Labour
|
| Normanton
|
|
Labour
|
3,143
|
3,578
|
1,162
|
472
|
673
|
527
|
9,555
|
|
Labour
|
| Pontefract & Castleford
|
|
Labour
|
2,144
|
4,485
|
643
|
311
|
465
|
525
|
8,573
|
|
Labour
|
| Pudsey
|
|
Labour
|
6,232
|
4,400
|
2,182
|
889
|
1,184
|
740
|
15,627
|
|
Conservative
|
| Richmond
|
|
Conservative
|
11,682
|
3,242
|
2,582
|
1,025
|
1,451
|
574
|
20,556
|
|
Conservative
|
| Rother Valley
|
|
Labour
|
2,709
|
4,789
|
1,284
|
511
|
790
|
599
|
10,682
|
|
Labour
|
| Rotherham
|
|
Labour
|
2,690
|
4,385
|
1,072
|
399
|
499
|
543
|
9,588
|
|
Labour
|
| Ryedale
|
|
Conservative
|
9,684
|
2,927
|
3,447
|
920
|
1,812
|
522
|
19,312
|
|
Conservative
|
| Scarborough & Whitby
|
|
Labour
|
8,407
|
4,208
|
2,310
|
1,064
|
1,660
|
585
|
18,234
|
|
Conservative
|
| Scunthorpe
|
|
Labour
|
3,693
|
3,790
|
1,017
|
406
|
632
|
457
|
9,995
|
|
Labour
|
| Selby
|
|
Labour
|
8,542
|
4,852
|
2,248
|
938
|
1,453
|
591
|
18,624
|
|
Conservative
|
| Sheffield, Attercliffe
|
|
Labour
|
1,996
|
4,637
|
1,649
|
394
|
534
|
532
|
9,742
|
|
Labour
|
| Sheffield, Brightside
|
|
Labour
|
1,204
|
4,172
|
1,058
|
274
|
356
|
428
|
7,492
|
|
Labour
|
| Sheffield, Central
|
|
Labour
|
1,596
|
4,932
|
1,859
|
1,071
|
408
|
648
|
10,514
|
|
Labour
|
| Sheffield, Hallam
|
|
Liberal Democrat
|
6,299
|
3,218
|
4,267
|
1,215
|
653
|
584
|
16,236
|
|
Conservative
|
| Sheffield, Heeley
|
|
Labour
|
2,482
|
4,136
|
2,436
|
613
|
594
|
570
|
10,831
|
|
Labour
|
| Sheffield, Hillsborough
|
|
Labour
|
3,295
|
4,679
|
2,873
|
920
|
752
|
639
|
13,158
|
|
Labour
|
| Shipley
|
|
Labour
|
7,974
|
4,326
|
2,467
|
1,408
|
1,230
|
824
|
18,229
|
|
Conservative
|
| Skipton & Ripon
|
|
Conservative
|
11,408
|
3,556
|
3,288
|
1,295
|
1,996
|
768
|
22,311
|
|
Conservative
|
| Vale of York
|
|
Conservative
|
11,115
|
3,221
|
3,280
|
1,024
|
1,653
|
573
|
20,866
|
|
Conservative
|
| Wakefield
|
|
Labour
|
4,675
|
4,545
|
1,472
|
898
|
1,077
|
680
|
13,347
|
|
Conservative
|
| Wentworth
|
|
Labour
|
2,736
|
5,299
|
973
|
453
|
536
|
539
|
10,536
|
|
Labour
|
| City of York
|
|
Labour
|
5,784
|
5,961
|
2,529
|
1,398
|
938
|
689
|
17,299
|
|
Labour
|
Scotland[edit]
| Constituency
|
Party won in 1997
|
Con
|
Lab
|
Lib
|
SNP
|
Green
|
UKIP
|
Others
|
Total
|
Party won in 1999
|
| Aberdeen Central
|
|
Labour
|
1,699
|
3,131
|
1,081
|
3,026
|
615
|
107
|
671
|
10,330
|
|
Labour
|
| Aberdeen North
|
|
Labour
|
1,129
|
2,977
|
1,116
|
3,796
|
279
|
83
|
529
|
9,909
|
|
Scottish National Party
|
| Aberdeen South
|
|
Labour
|
3,672
|
3,287
|
2,267
|
3,846
|
620
|
131
|
705
|
14,528
|
|
Scottish National Party
|
| Airdrie and Shotts
|
|
Labour
|
1,291
|
5,257
|
538
|
2,645
|
318
|
123
|
1,114
|
11,286
|
|
Labour
|
| Angus
|
|
Scottish National Party
|
4,128
|
2,322
|
1,202
|
6,455
|
700
|
258
|
822
|
15,887
|
|
Scottish National Party
|
| Argyll and Bute
|
|
Liberal Democrat
|
3,665
|
2,359
|
2,438
|
5,079
|
998
|
299
|
1,031
|
15,869
|
|
Scottish National Party
|
| Ayr
|
|
Labour
|
6,221
|
4,633
|
904
|
3,614
|
612
|
178
|
1,175
|
17,337
|
|
Conservative
|
| Banff and Buchan
|
|
Scottish National Party
|
2,828
|
1,321
|
886
|
6,953
|
436
|
179
|
618
|
13,221
|
|
Scottish National Party
|
| Caithness, Sutherland and Easter Ross
|
|
Liberal Democrat
|
1,925
|
2,029
|
2,325
|
3,310
|
576
|
251
|
643
|
11,059
|
|
Scottish National Party
|
| Carrick, Cumnock and Doon Valley
|
|
Labour
|
4,201
|
5,953
|
752
|
3,678
|
537
|
194
|
1,143
|
16,458
|
|
Labour
|
| Central Fife
|
|
Labour
|
1,357
|
5,494
|
751
|
4,125
|
446
|
132
|
783
|
13,088
|
|
Labour
|
| Clydebank and Milngavie
|
|
Labour
|
2,159
|
5,288
|
1,566
|
4,071
|
719
|
120
|
1,240
|
15,163
|
|
Labour
|
| Clydesdale
|
|
Labour
|
2,841
|
5,336
|
964
|
4,494
|
679
|
186
|
1,152
|
15,652
|
|
Labour
|
| Coatbridge and Chryston
|
|
Labour
|
1,238
|
5,622
|
520
|
2,380
|
453
|
72
|
1,323
|
11,608
|
|
Labour
|
| Cumbernauld and Kilsyth
|
|
Labour
|
899
|
4,135
|
546
|
4,110
|
542
|
61
|
1,193
|
11,486
|
|
Labour
|
| Cunninghame North
|
|
Labour
|
3,917
|
4,107
|
1,093
|
3,958
|
746
|
265
|
1,126
|
15,212
|
|
Labour
|
| Cunninghame South
|
|
Labour
|
1,413
|
4,005
|
502
|
2,811
|
367
|
145
|
994
|
10,237
|
|
Labour
|
| Dumbarton
|
|
Labour
|
3,047
|
4,530
|
1,273
|
4,180
|
711
|
239
|
1,326
|
15,306
|
|
Labour
|
| Dumfries
|
|
Labour
|
5,471
|
4,525
|
1,409
|
3,413
|
702
|
459
|
1,146
|
17,125
|
|
Conservative
|
| Dundee East
|
|
Labour
|
2,643
|
4,238
|
743
|
5,740
|
555
|
142
|
966
|
15,027
|
|
Scottish National Party
|
| Dundee West
|
|
Labour
|
1,894
|
4,284
|
771
|
4,519
|
629
|
119
|
1,096
|
13,312
|
|
Scottish National Party
|
| Dunfermline East
|
|
Labour
|
1,590
|
5,360
|
714
|
2,985
|
487
|
159
|
899
|
12,194
|
|
Labour
|
| Dunfermline West
|
|
Labour
|
1,914
|
4,302
|
1,498
|
3,384
|
645
|
164
|
815
|
12,722
|
|
Labour
|
| East Kilbride
|
|
Labour
|
2,302
|
5,669
|
1,045
|
5,017
|
991
|
129
|
1,555
|
16,708
|
|
Labour
|
| East Lothian
|
|
Labour
|
3,739
|
5,199
|
1,365
|
3,272
|
985
|
179
|
827
|
15,566
|
|
Labour
|
| Eastwood
|
|
Labour
|
6,542
|
4,584
|
1,729
|
4,184
|
1,073
|
160
|
1,401
|
19,673
|
|
Conservative
|
| Edinburgh Central
|
|
Labour
|
3,253
|
4,324
|
1,878
|
3,674
|
2,322
|
172
|
1,223
|
16,846
|
|
Labour
|
| Edinburgh East and Musselburgh
|
|
Labour
|
2,545
|
5,629
|
1,382
|
4,172
|
1,446
|
147
|
1,157
|
16,478
|
|
Labour
|
| Edinburgh North and Leith
|
|
Labour
|
2,911
|
4,573
|
1,693
|
3,866
|
2,192
|
150
|
1,134
|
16,519
|
|
Labour
|
| Edinburgh Pentlands
|
|
Labour
|
5,450
|
4,743
|
2,147
|
4,009
|
1,496
|
180
|
1,006
|
19,031
|
|
Conservative
|
| Edinburgh South
|
|
Labour
|
4,266
|
4,990
|
2,904
|
3,634
|
2,307
|
187
|
1,070
|
19,358
|
|
Labour
|
| Edinburgh West
|
|
Liberal Democrat
|
5,691
|
3,757
|
4,090
|
3,808
|
1,257
|
192
|
911
|
19,706
|
|
Conservative
|
| Falkirk East
|
|
Labour
|
1,713
|
4,175
|
705
|
3,658
|
526
|
189
|
871
|
11,837
|
|
Labour
|
| Falkirk West
|
|
Labour
|
1,729
|
4,323
|
595
|
3,652
|
487
|
139
|
1,018
|
11,943
|
|
Labour
|
| Galloway and Upper Nithsdale
|
|
Scottish National Party
|
6,004
|
2,571
|
1,417
|
4,832
|
853
|
501
|
1,137
|
17,315
|
|
Conservative
|
| Glasgow, Anniesland
|
|
Labour
|
1,720
|
4,795
|
903
|
2,670
|
850
|
93
|
1,513
|
12,544
|
|
Labour
|
| Glasgow Baillieston
|
|
Labour
|
778
|
3,530
|
316
|
2,350
|
289
|
68
|
1,252
|
8,583
|
|
Labour
|
| Glasgow Cathcart
|
|
Labour
|
1,725
|
4,108
|
704
|
2,783
|
757
|
80
|
1,323
|
11,480
|
|
Labour
|
| Glasgow Govan
|
|
Labour
|
1,495
|
3,240
|
621
|
2,882
|
854
|
86
|
1,391
|
10,569
|
|
Labour
|
| Glasgow Kelvin
|
|
Labour
|
1,360
|
3,695
|
1,242
|
3,030
|
1,637
|
117
|
1,494
|
12,575
|
|
Labour
|
| Glasgow Maryhill
|
|
Labour
|
553
|
3,648
|
649
|
2,185
|
703
|
70
|
1,226
|
9,034
|
|
Labour
|
| Glasgow Pollok
|
|
Labour
|
821
|
3,983
|
360
|
2,713
|
358
|
75
|
1,926
|
10,236
|
|
Labour
|
| Glasgow Rutherglen
|
|
Labour
|
1,627
|
4,629
|
1,522
|
2,382
|
539
|
72
|
1,232
|
12,003
|
|
Labour
|
| Glasgow Shettleston
|
|
Labour
|
565
|
3,682
|
288
|
1,860
|
322
|
58
|
1,180
|
7,955
|
|
Labour
|
| Glasgow, Springburn
|
|
Labour
|
666
|
4,612
|
360
|
2,199
|
451
|
64
|
1,462
|
9,814
|
|
Labour
|
| Gordon
|
|
Liberal Democrat
|
3,303
|
1,560
|
2,890
|
3,721
|
657
|
213
|
617
|
12,961
|
|
Scottish National Party
|
| Greenock and Inverclyde
|
|
Labour
|
1,617
|
3,667
|
1,544
|
2,655
|
523
|
126
|
1,008
|
11,140
|
|
Labour
|
| Hamilton North and Bellshill
|
|
Labour
|
1,410
|
4,872
|
574
|
2,698
|
429
|
85
|
1,095
|
11,163
|
|
Labour
|
| Hamilton South
|
|
Labour
|
1,074
|
4,281
|
480
|
2,496
|
367
|
82
|
930
|
9,710
|
|
Labour
|
| Inverness East, Nairn and Lochaber
|
|
Labour
|
4,048
|
4,037
|
2,517
|
6,714
|
1,316
|
420
|
1,147
|
20,199
|
|
Scottish National Party
|
| Kilmarnock and Loudoun
|
|
Labour
|
2,285
|
5,080
|
802
|
5,032
|
615
|
159
|
1,162
|
15,135
|
|
Labour
|
| Kirkcaldy
|
|
Labour
|
1,735
|
4,696
|
941
|
3,523
|
591
|
136
|
862
|
12,484
|
|
Labour
|
| Linlithgow
|
|
Labour
|
1,576
|
4,612
|
790
|
4,173
|
652
|
122
|
805
|
12,730
|
|
Labour
|
| Livingston
|
|
Labour
|
1,452
|
4,481
|
834
|
4,262
|
761
|
154
|
903
|
12,847
|
|
Labour
|
| Midlothian
|
|
Labour
|
1,389
|
5,130
|
919
|
3,030
|
753
|
115
|
765
|
12,101
|
|
Labour
|
| Moray
|
|
Scottish National Party
|
4,105
|
2,613
|
1,495
|
4,474
|
852
|
421
|
934
|
14,894
|
|
Scottish National Party
|
| Motherwell and Wishaw
|
|
Labour
|
1,432
|
4,959
|
579
|
2,845
|
338
|
88
|
1,173
|
11,414
|
|
Labour
|
| North East Fife
|
|
Liberal Democrat
|
4,889
|
1,928
|
4,002
|
3,232
|
1,245
|
267
|
878
|
16,441
|
|
Conservative
|
| North Tayside
|
|
Scottish National Party
|
6,581
|
1,997
|
1,457
|
7,603
|
1,040
|
342
|
944
|
19,964
|
|
Scottish National Party
|
| Ochil
|
|
Labour
|
2,635
|
4,329
|
1,038
|
4,639
|
760
|
160
|
836
|
14,397
|
|
Scottish National Party
|
| Orkney and Shetland
|
|
Liberal Democrat
|
1,336
|
1,097
|
2,233
|
1,571
|
732
|
162
|
481
|
7,612
|
|
Liberal Democrat
|
| Paisley North
|
|
Labour
|
1,377
|
4,218
|
876
|
3,177
|
472
|
99
|
1,120
|
11,339
|
|
Labour
|
| Paisley South
|
|
Labour
|
1,348
|
4,686
|
1,002
|
3,508
|
504
|
110
|
1,050
|
12,208
|
|
Labour
|
| Perth
|
|
Scottish National Party
|
5,798
|
2,955
|
1,615
|
5,031
|
1,116
|
338
|
951
|
17,804
|
|
Conservative
|
| Ross, Skye and Inverness West
|
|
Liberal Democrat
|
2,958
|
2,720
|
3,076
|
4,922
|
1,342
|
403
|
935
|
16,356
|
|
Liberal Democrat
|
| Roxburgh and Berwickshire
|
|
Liberal Democrat
|
3,805
|
1,534
|
2,584
|
2,016
|
758
|
346
|
738
|
11,781
|
|
Liberal Democrat
|
| Stirling
|
|
Labour
|
4,728
|
3,895
|
1,445
|
4,112
|
1,198
|
176
|
1,099
|
16,653
|
|
Conservative
|
| Strathkelvin and Bearsden
|
|
Labour
|
4,029
|
5,290
|
2,004
|
4,484
|
1,056
|
147
|
1,273
|
18,283
|
|
Labour
|
| Tweeddale, Ettrick and Lauderdale
|
|
Liberal Democrat
|
3,505
|
2,502
|
3,094
|
3,414
|
1,227
|
241
|
777
|
14,760
|
|
Conservative
|
| West Aberdeenshire and Kincardine
|
|
Liberal Democrat
|
4,760
|
1,676
|
2,891
|
3,755
|
844
|
222
|
637
|
14,785
|
|
Conservative
|
| West Renfrewshire
|
|
Labour
|
2,838
|
3,872
|
1,157
|
3,795
|
687
|
134
|
1,031
|
13,514
|
|
Labour
|
| Western Isles
|
|
Labour
|
686
|
1,849
|
358
|
2,242
|
240
|
107
|
364
|
5,846
|
|
Scottish National Party
|
| Constituency
|
Party won in 1997
|
Con
|
Lab
|
Lib
|
PC
|
Green
|
UKIP
|
Others
|
Total
|
Party won in 1999
|
| Aberavon
|
|
Labour
|
1,641
|
6,063
|
877
|
3,776
|
192
|
314
|
261
|
13,124
|
|
Labour
|
| Alyn & Deeside
|
|
Labour
|
3,720
|
4,893
|
999
|
1,316
|
317
|
775
|
244
|
12,264
|
|
Labour
|
| Blaenau Gwent
|
|
Labour
|
1,284
|
7,039
|
787
|
3,043
|
227
|
310
|
210
|
12,900
|
|
Labour
|
| Brecon & Radnorshire
|
|
Liberal Democrat
|
7,899
|
4,191
|
3,958
|
2,840
|
727
|
837
|
338
|
20,790
|
|
Conservative
|
| Bridgend
|
|
Labour
|
4,463
|
5,813
|
1,696
|
3,348
|
351
|
470
|
328
|
16,469
|
|
Labour
|
| Caernarfon
|
|
Plaid Cymru
|
2,372
|
2,769
|
698
|
11,520
|
356
|
364
|
301
|
18,380
|
|
Plaid Cymru
|
| Caerphilly
|
|
Labour
|
2,241
|
6,309
|
1,010
|
5,488
|
349
|
371
|
267
|
16,035
|
|
Labour
|
| Cardiff Central
|
|
Labour
|
3,426
|
3,802
|
2,866
|
2,057
|
553
|
328
|
261
|
13,293
|
|
Labour
|
| Cardiff North
|
|
Labour
|
6,845
|
5,648
|
1,849
|
3,101
|
548
|
640
|
301
|
18,932
|
|
Conservative
|
| Cardiff South and Penarth
|
|
Labour
|
3,803
|
4,987
|
1,017
|
2,153
|
422
|
354
|
351
|
13,087
|
|
Labour
|
| Cardiff West
|
|
Labour
|
3,488
|
4,489
|
1,014
|
2,691
|
472
|
366
|
235
|
12,755
|
|
Labour
|
| Carmarthen East and Dinefwr
|
|
Labour
|
3,042
|
5,265
|
867
|
11,171
|
625
|
495
|
294
|
21,759
|
|
Plaid Cymru
|
| Carmarthen West and South Pembrokeshire
|
|
Plaid Cymru
|
5,181
|
4,728
|
1,057
|
5,441
|
554
|
640
|
332
|
17,933
|
|
Plaid Cymru
|
| Ceredigion
|
|
Plaid Cymru
|
3,696
|
3,069
|
1,607
|
10,821
|
873
|
619
|
377
|
21,062
|
|
Plaid Cymru
|
| Clwyd South
|
|
Labour
|
3,544
|
4,913
|
1,092
|
3,656
|
373
|
608
|
283
|
14,469
|
|
Labour
|
| Clwyd West
|
|
Labour
|
5,579
|
3,742
|
1,576
|
5,077
|
401
|
686
|
375
|
17,436
|
|
Conservative
|
| Conwy
|
|
Labour
|
4,296
|
4,411
|
3,151
|
5,351
|
421
|
563
|
360
|
18,553
|
|
Plaid Cymru
|
| Cynon Valley
|
|
Labour
|
1,089
|
4,891
|
518
|
4,594
|
203
|
242
|
164
|
11,701
|
|
Labour
|
| Delyn
|
|
Labour
|
3,997
|
5,310
|
1,397
|
2,797
|
322
|
585
|
308
|
14,716
|
|
Labour
|
| Gower
|
|
Labour
|
4,149
|
5,336
|
1,188
|
4,987
|
490
|
540
|
337
|
17,027
|
|
Labour
|
| Islwyn
|
|
Labour
|
1,438
|
5,378
|
676
|
5,470
|
227
|
292
|
179
|
13,660
|
|
Plaid Cymru
|
| Llanelli
|
|
Labour
|
1,918
|
6,340
|
795
|
8,698
|
345
|
320
|
289
|
18,705
|
|
Plaid Cymru
|
| Meirionnydd Nant Conwy
|
|
Plaid Cymru
|
2,198
|
2,028
|
788
|
7,160
|
324
|
353
|
233
|
13,084
|
|
Plaid Cymru
|
| Merthyr Tydfil & Rhymney
|
|
Labour
|
1,340
|
6,177
|
732
|
4,033
|
246
|
346
|
258
|
13,132
|
|
Labour
|
| Monmouth
|
|
Labour
|
9,328
|
6,081
|
1,834
|
1,974
|
741
|
996
|
451
|
21,405
|
|
Conservative
|
| Montgomeryshire
|
|
Liberal Democrat
|
3,947
|
2,161
|
2,931
|
2,881
|
512
|
796
|
266
|
13,494
|
|
Conservative
|
| Neath
|
|
Labour
|
1,818
|
7,299
|
838
|
6,801
|
351
|
300
|
310
|
17,717
|
|
Labour
|
| Newport East
|
|
Labour
|
3,134
|
4,368
|
967
|
1,563
|
278
|
517
|
284
|
11,111
|
|
Labour
|
| Newport West
|
|
Labour
|
4,537
|
5,256
|
895
|
1,589
|
405
|
536
|
329
|
13,547
|
|
Labour
|
| Ogmore
|
|
Labour
|
1,281
|
6,057
|
565
|
3,923
|
193
|
306
|
237
|
12,562
|
|
Labour
|
| Pontypridd
|
|
Labour
|
2,618
|
5,951
|
1,462
|
5,626
|
429
|
461
|
267
|
16,814
|
|
Labour
|
| Preseli Pembrokeshire
|
|
Labour
|
5,304
|
4,678
|
1,181
|
5,144
|
634
|
658
|
349
|
17,948
|
|
Conservative
|
| Rhondda
|
|
Labour
|
872
|
6,748
|
512
|
7,507
|
267
|
174
|
247
|
16,327
|
|
Plaid Cymru
|
| Swansea East
|
|
Labour
|
1,498
|
4,453
|
852
|
3,088
|
180
|
226
|
188
|
10,485
|
|
Labour
|
| Swansea West
|
|
Labour
|
3,401
|
4,170
|
1,321
|
3,410
|
402
|
396
|
270
|
13,370
|
|
Labour
|
| Torfaen
|
|
Labour
|
2,363
|
6,411
|
1,110
|
2,311
|
436
|
587
|
258
|
13,476
|
|
Labour
|
| Vale of Clwyd
|
|
Labour
|
4,749
|
4,590
|
1,072
|
3,383
|
306
|
725
|
360
|
15,185
|
|
Conservative
|
| Vale of Glamorgan
|
|
Labour
|
7,973
|
6,472
|
1,445
|
4,065
|
486
|
567
|
441
|
21,449
|
|
Conservative
|
| Wrexham
|
|
Labour
|
3,073
|
3,917
|
1,219
|
1,783
|
255
|
538
|
211
|
10,996
|
|
Labour
|
| Ynys Mon
|
|
Plaid Cymru
|
4,086
|
3,487
|
864
|
9,598
|
353
|
501
|
384
|
19,273
|
|
Plaid Cymru
|
References[edit]
External links[edit]
Election results in the United Kingdom |
|---|
| Election results by year | |
|---|
| General election results by region | |
|---|
| Non general elections | |
|---|
| Other | |
|---|
|


.svg)